Start of the overlay
Image description

Line graph of 30-year mortgage rate versus residential median home price and Bar chart as monthly payments between April 2021 and 2022


There are two charts here. The 1st chart shows the 30yr mortgage rate (in percentage) and home price (in thousands of $) from February 2017 until April 2022. The first point for mortgage rates and residential median price came in at 4% and $258, respectively. From there, mortgage rates rose to 4.8% before declining 3.7% by March 2020. Here, it rose to 4.1% before declining to 2.8% by February 2021. Then, mortgage rates rose to 3.2% by December 2021, before surging to 5.4% by April 2022. In the meantime, residential median price rose to $302 by March 2020, before slightly dipping to $292 on May 2020. From there until recently, it rose to $413. The 2nd chart shows the monthly mortgage payments in April 2021 and April 2022. The monthly payments in April 2021 and April 2022 were $1,228 and $1,859, respectively. There was a rise in mortgage payments of $631 in a year.

End of the overlay

Top Market Takeaways Quick shot: How Main Street feels tighter Fed policy

Published May 24, 2022
The Know Top Market Takeaways

There’s a lot of uncertainty plaguing the investments landscape, and the wild market swings of late are emblematic of investors’ apprehension about the path forward. Inflation is still running hot, and the Fed is following a speedy path of rate hikes to try to slow it down. To do so, they need broader economic activity to slow down. As such, they want us all to feel less inclined to borrow money and spend it elsewhere.


That’s why their control over interest rates is so important – higher interest rates make it more expensive to borrow, removing the incentive to do so. Although the Fed has only delivered a couple of rate hikes so far, the market knows more are coming and has moved to price them in. Already, we’re starting to see the effects.


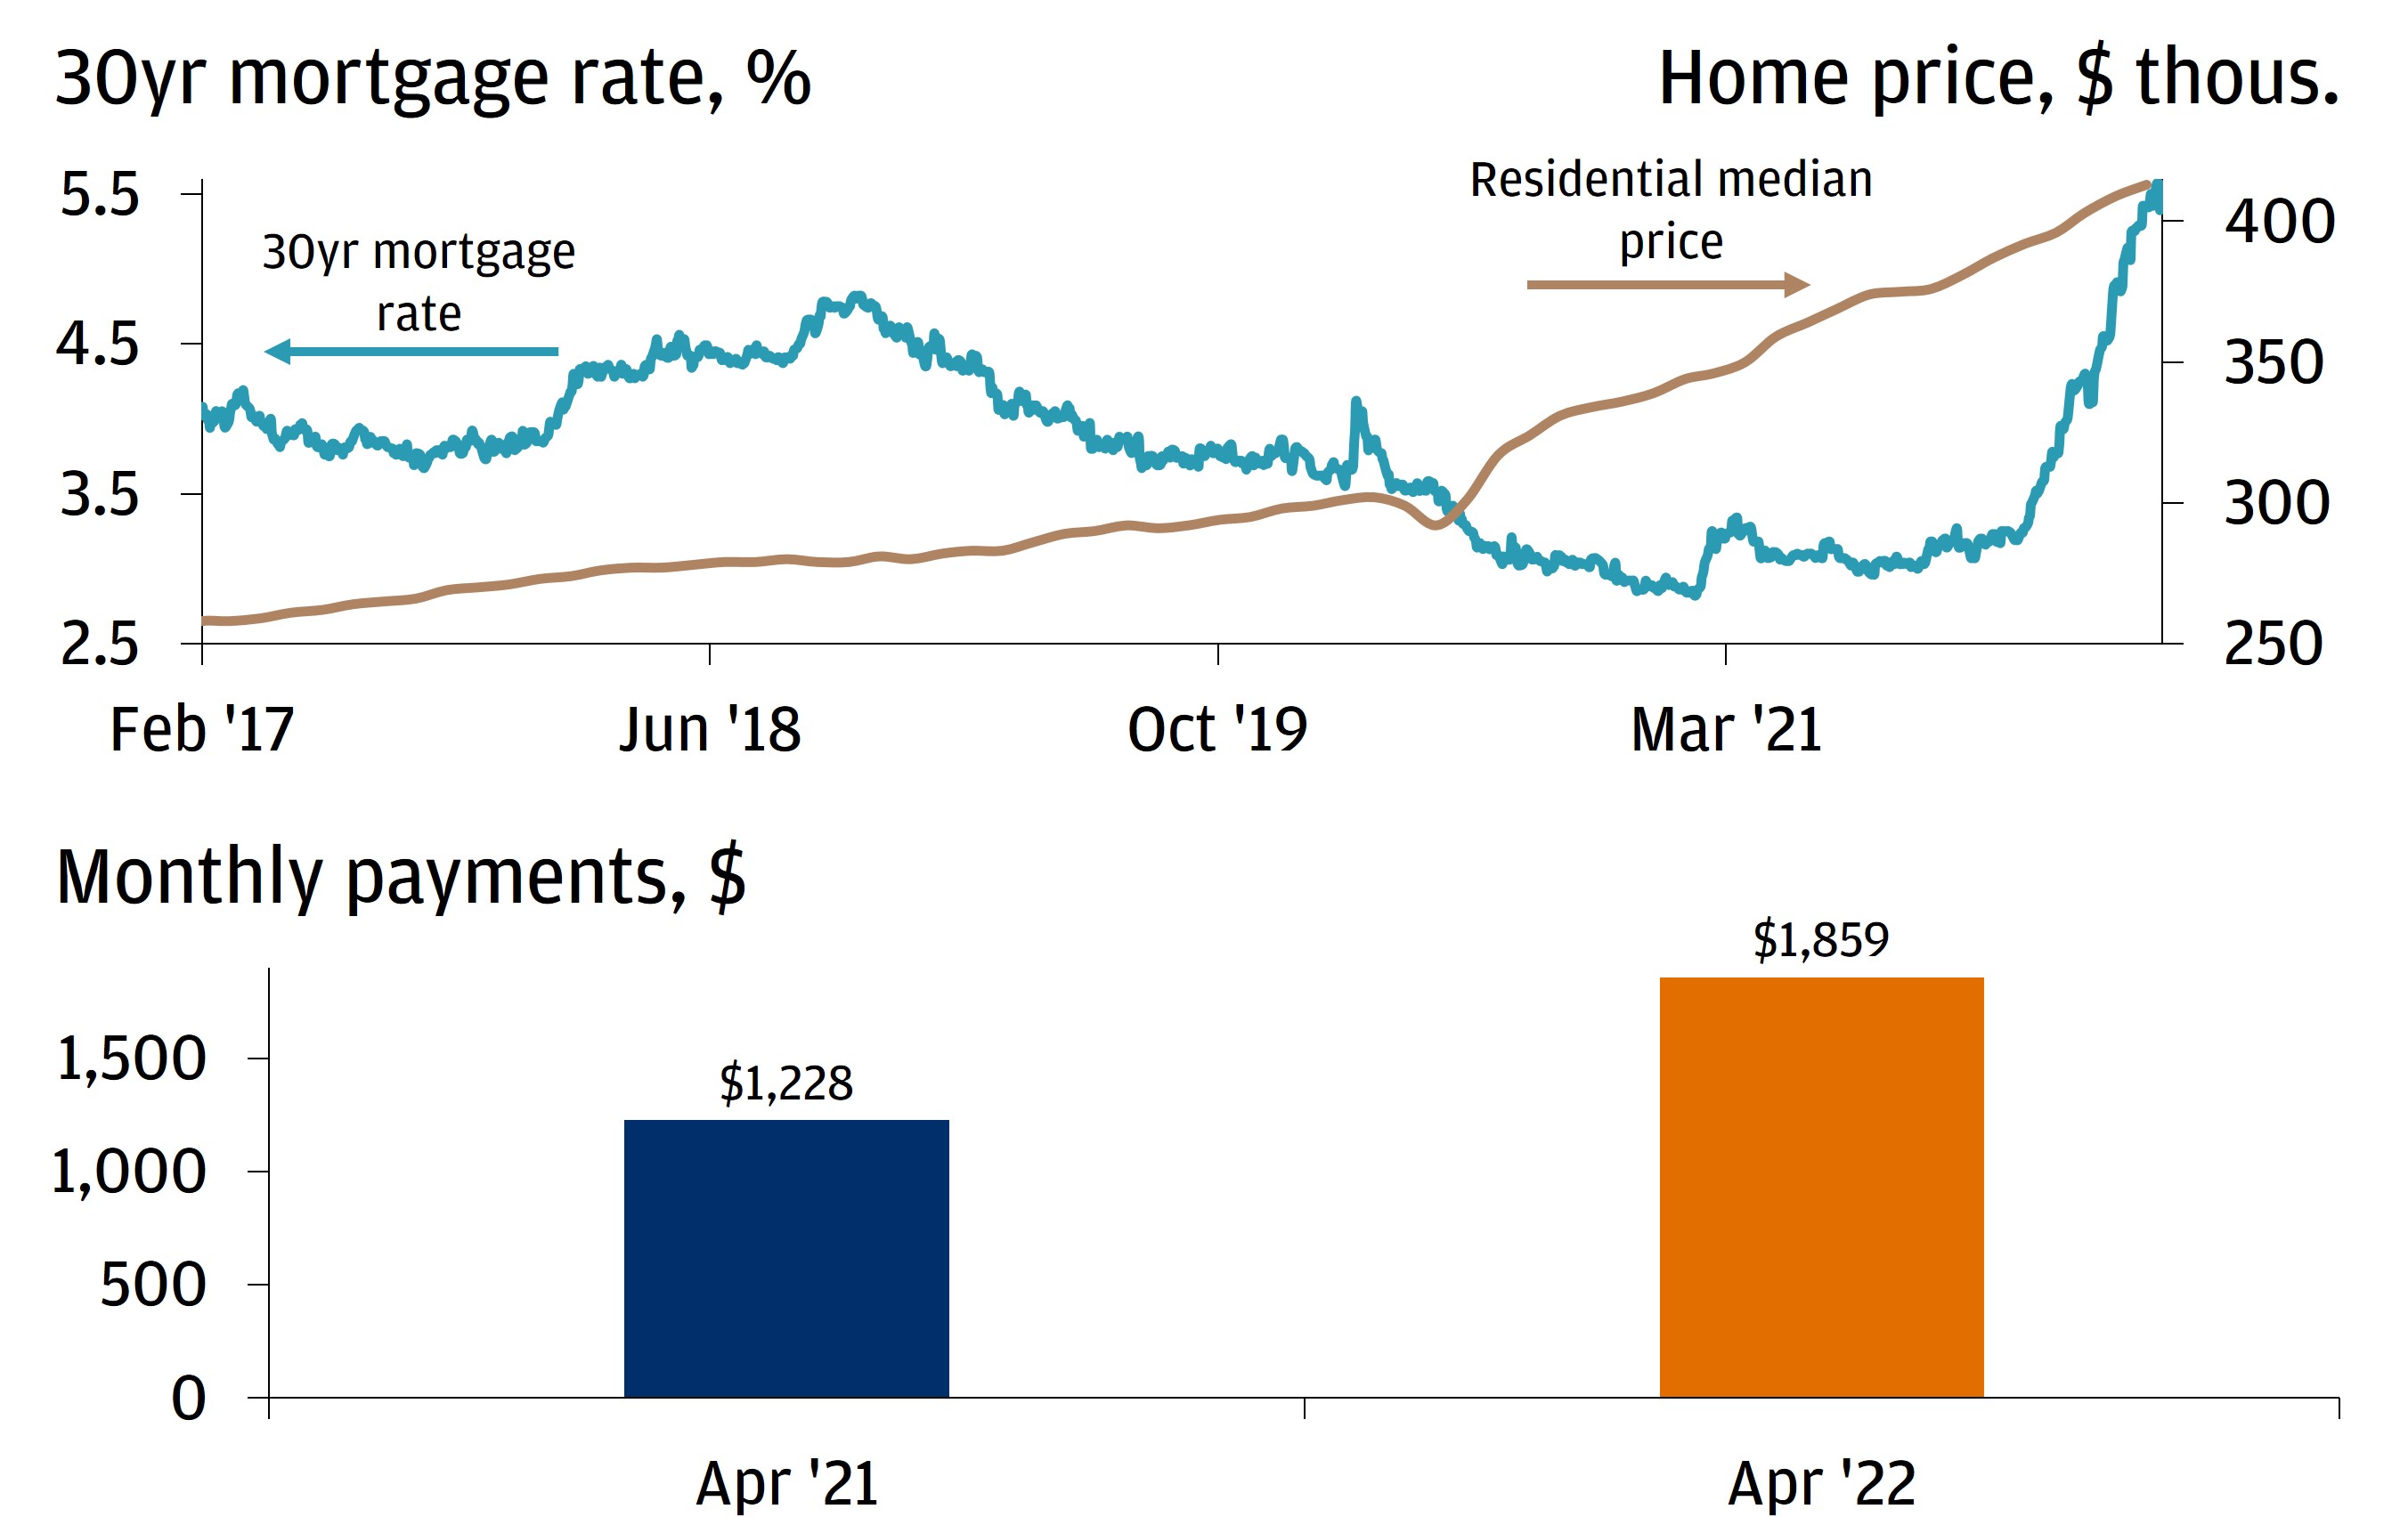
Being very interest rate sensitive, the housing market tends to be one of the first places that the effects of changes in Fed policy start to show up. 30-year fixed mortgage rates have shot higher at one of their fastest paces on record year-to-date. Today, a new 30-year mortgage comes with an interest rate of 5.5%, versus 3.1% one year ago. Combine that with the climb in home prices seen over the past couple of years, and it’s made buying a home much less affordable: The payment on a new 30-year fixed mortgage to buy the typical single family home in America today has increased more than $600 a month versus a year ago!


As a result, it’s no wonder we’re starting to see mortgage application activity soften and overall home sales come down. To us, that’s a sign that the Fed’s policy moves will ultimately have the desired effects of slowing economic growth and inflation in the economy more broadly. The risk is that the Fed overdoes it, and slows growth to the point of recession. That’s not our base case, but we’ll be watching data closely in the next few months for signs that things could be changing.

HIGHER MORTGAGE RATES AND HOME VALUE APPRECIATION HAVE MADE THE COST OF HOME OWNERSHIP RISE MEANINGFULLY

Line graph of 30-year mortgage rate versus residential median home price and Bar chart as monthly payments between April 2021 and 2022
Source: Redfin, Haver Analytics, Bloomberg Finance L.P. Data as of April 30, 2022. Note: Monthly mortgage payment assumes a 20% down payment, the median single family home price, and the 30-year mortgage rate at the time specified.
See expandable image , opens new browser window | Show text version, opens overlay

All market data from Bloomberg Finance L.P., 5/23/22.

Invest your way

Not working with us yet? Find a J.P. Morgan Advisor or explore ways to invest online. 

Continue

You may also like

Article Economic outlook Why investors shouldn’t take their eyes off AI’s impact in 2025

Although the AI conversation has been partly shadowed by political discourse in 2025, its transformative potential has just begun to take shape. Read more here.

By Federico Cuevas
2 min read
Top Market Takeaways

Article Top Market Takeaways 5 things working in markets today

In a shifting market landscape marked both by uncertainty and near all-time highs, we focus on what’s working.

By Federico Cuevas
Top Market Takeaways

Article Top Market Takeaways What’s been the tariff impact on U.S. businesses since “Liberation Day”?

We continue to track the impact of tariffs on the U.S. economy, from changing import prices to rising tariff collections and more.

By Vinny Amaru

Invest your way

From online investing to working with an advisor, J.P. Morgan is ready to help you achieve your goals.

Continue, to investment offers page.

Disclosures

Our Top Market Takeaways for May 23rd, 2022.

All companies referenced are shown for illustrative purposes only, and are not intended as a recommendation or endorsement by J.P. Morgan in this context.

The S&P 500 Index is an unmanaged broad-...

Read more disclosures about this article

Our Top Market Takeaways for May 23rd, 2022.

All companies referenced are shown for illustrative purposes only, and are not intended as a recommendation or endorsement by J.P. Morgan in this context.

The S&P 500 Index is an unmanaged broad-based index that is used as representation of the U.S. stock market. It includes 500 widely held common stocks. Total return figures reflect the reinvestment of dividends. “S&P500” is a trademark of Standard and Poor’s Corporation.

Not all option strategies are suitable for all investors. Certain strategies may expose investors to significant potential risks and losses. For additional risk information, please read the “Characteristics and Risks of Standardized Options”. We advise investors to consult their tax advisors and legal counsel about the tax implications of these strategies. Investors are urged to carefully consider whether options or option-related products or strategies are suitable for their needs.

All market and economic data as of May 2022 and sourced from Bloomberg and FactSet unless otherwise stated.

We believe the information contained in this material to be reliable but do not warrant its accuracy or completeness. Opinions, estimates, and investment strategies and views expressed in this document constitute our judgment based on current market conditions and are subject to change without notice.

RISK CONSIDERATIONS

  • Past performance is not indicative of future results. You may not invest directly in an index.
  • The prices and rates of return are indicative, as they may vary over time based on market conditions.
  • Additional risk considerations exist for all strategies.
  • The information provided herein is not intended as a recommendation of or an offer or solicitation to purchase or sell any investment product or service.
  • Opinions expressed herein may differ from the opinions expressed by other areas of J.P. Morgan. This material should not be regarded as investment research or a J.P. Morgan investment research report.

The views, opinions, estimates and strategies expressed herein constitutes the author's judgment based on current market conditions and are subject to change without notice, and may differ from those expressed by other areas of J.P. Morgan. This information in no way constitutes J.P. Morgan Research and should not be treated as such. You should carefully consider your needs and objectives before making any decisions. For additional guidance on how this information should be applied to your situation, you should consult your advisor.

In general, the bond market is volatile and bond prices rise when interest rates fall and vice versa. Longer term securities are more prone to price fluctuation than shorter term securities. Any fixed income security sold or redeemed prior to maturity may be subject to substantial gain or loss. Dependable income is subject to the credit risk of the issuer of the bond. If an issuer defaults no future income payments will be made.

The price of equity securities may rise or fall due to the changes in the broad market or changes in a company's financial condition, sometimes rapidly or unpredictably. Equity securities are subject to 'stock market risk' meaning that stock prices in general may decline over short or extended periods of time.

International investments may not be suitable for all investors. International investing involves a greater degree of risk and increased volatility. Changes in currency exchange rates and differences in accounting and taxation policies outside the U.S. can raise or lower returns. Some overseas markets may not be as politically and economically stable as the United States and other nations. Investments in international markets can be more volatile.

Show Less