Start of the overlay
Image description

Central bank policy rates and market expectations, percent


This chart shows central bank policy rates and expectations, for the Federal Reserve, Bank of England, European Central Bank, Swiss National Bank, and the Bank of Japan.


For the Federal Reserve, the series begins at 1.75% in January 2020, and falls to 0.25% in March 2020. It stays at that level until March 2022. From here it steadily increases to 5.50% in August 2023. Market expectations forecast this rate to be 4.47% in January 2025.


For the Bank of England, the series begins at 0.75% in January 2020, and falls to 0.1% in March 2020. It stays at that level until December 2021. From here it steadily increases to 5.25% in August 2023. Market expectations forecast this rate to be 4.31% in February 2025.


For the European Central Bank, the series begins at -0.5% in January 2020. It stays at this level until July 2022, before increasing to 4.0% in October 2023. Market expectations forecast this rate to be 3.08% in December 2024.


For the Swiss National bank, the series begins at -0.75% in January 2020. It stays here until June 2022, before increasing to 1.75% in June 2023. It fell to 1.5% in March 2024. Market expectations forecast this rate to be 1.02% in December 2024.


For the Bank of Japan, the series begins at -0.1% in January 2020. It stays at this level until March 2024, where it increases to 0.1%. Market expectations forecast this rate to be 0.36% in December 2024.

End of the overlay
Start of the overlay
Image description

S&P 500 Index constituent year-to-date returns, percent


This chart shows the performance of S&P 500 constituents year-to-date in percent.


186 constituents outperformed the S&P 500 return of 10.3%. 369 constituents had a positive performance. While 134 had negative returns and 317 underperformed the index.

End of the overlay
Start of the overlay
Image description

Rolling 5-year correlation between changes in P/E multiples and changes in 10-year Treasury bond prices


The chart describes rolling 5-year correlation between changes in P/E multiples and changes in 10-yearTreasury bond prices. The first data point came in at -0.13 for 1940. Then it spiked to hit 0.55 in 1948. Later it dropped to -0.41 in 1963. Then it went up to peak at 0.66 in 1986. Later it tanked and bottomed at -0.62. in 2010. The last data point came in at 0.27 for Q3 2023. There is an arrow pointing up indicating unfavorable and another arrow pointing down indicating favorable.

End of the overlay
Start of the overlay
Image description

2024 LTCMA annualized long-term expected return, USD terms, percent


This chart shows the 2024 LTCMA annualized long-term expected return across several asset classes.


Cash


  • For U.S. Cash, the expected annual return is 2.9%.
  • For U.S. Inflation, the expected annual return is 2.5%.


Fixed Income


  • For U.S. Muni 1-15Yr Blend, the expected annual return is 6.8%.
  • For U.S. High Yield Bonds, the expected annual return is 6.5%.
  • For U.S. Inv Grade Corporate Bonds, the expected annual return is 5.8%.
  • For World Government Bonds, the expected annual return is 4.8%.


Equities


  • For Euro Area Large Cap, the expected annual return is 9.7%.
  • For Emerging Markets Equity, the expected annual return is 8.8%.
  • For AC World Equity, the expected annual return is 7.8%.
  • For U.S. Mid Cap, the expected annual return is 7.6%.
  • For U.S. Small Cap, the expected annual return is 7.2%.
  • For U.S. Large Cap, the expected annual return is 7.0%.


Alternatives


  • For Private Equity, the expected annual return is 9.7%.
  • For U.S. Core Real Estate, the expected annual return is 7.5%.
  • For Diversified Hedge Funds, the expected annual return is 5.0%.
End of the overlay

Top Market Takeaways The race to rate cuts is on: What it means for you

Updated Mar 22, 2024

By: Madison Faller and Samuel Zief


It’s happening: Rate cuts are officially here and more are on the way.


That was the resounding message from the flurry of central banks that met this week.


Many have been skeptical, and for good reason: Inflation has felt like the problem that just wouldn’t go away. But with price pressures now abating, and policymakers shifting their focus to the risk of overtightening, times are changing. Markets are taking notice: A global 60/40 stock/bond allocation is having its best week of the year so far.


Is your portfolio ready?


The race to rate cuts is officially on


With a string of hot data – from jobs to inflation – to start the year, doubts were starting to grow that central bankers would deliver rate cuts at all in 2024.


Instead, this week brought an entirely different message from the central bank chorus: The pivot is happening.


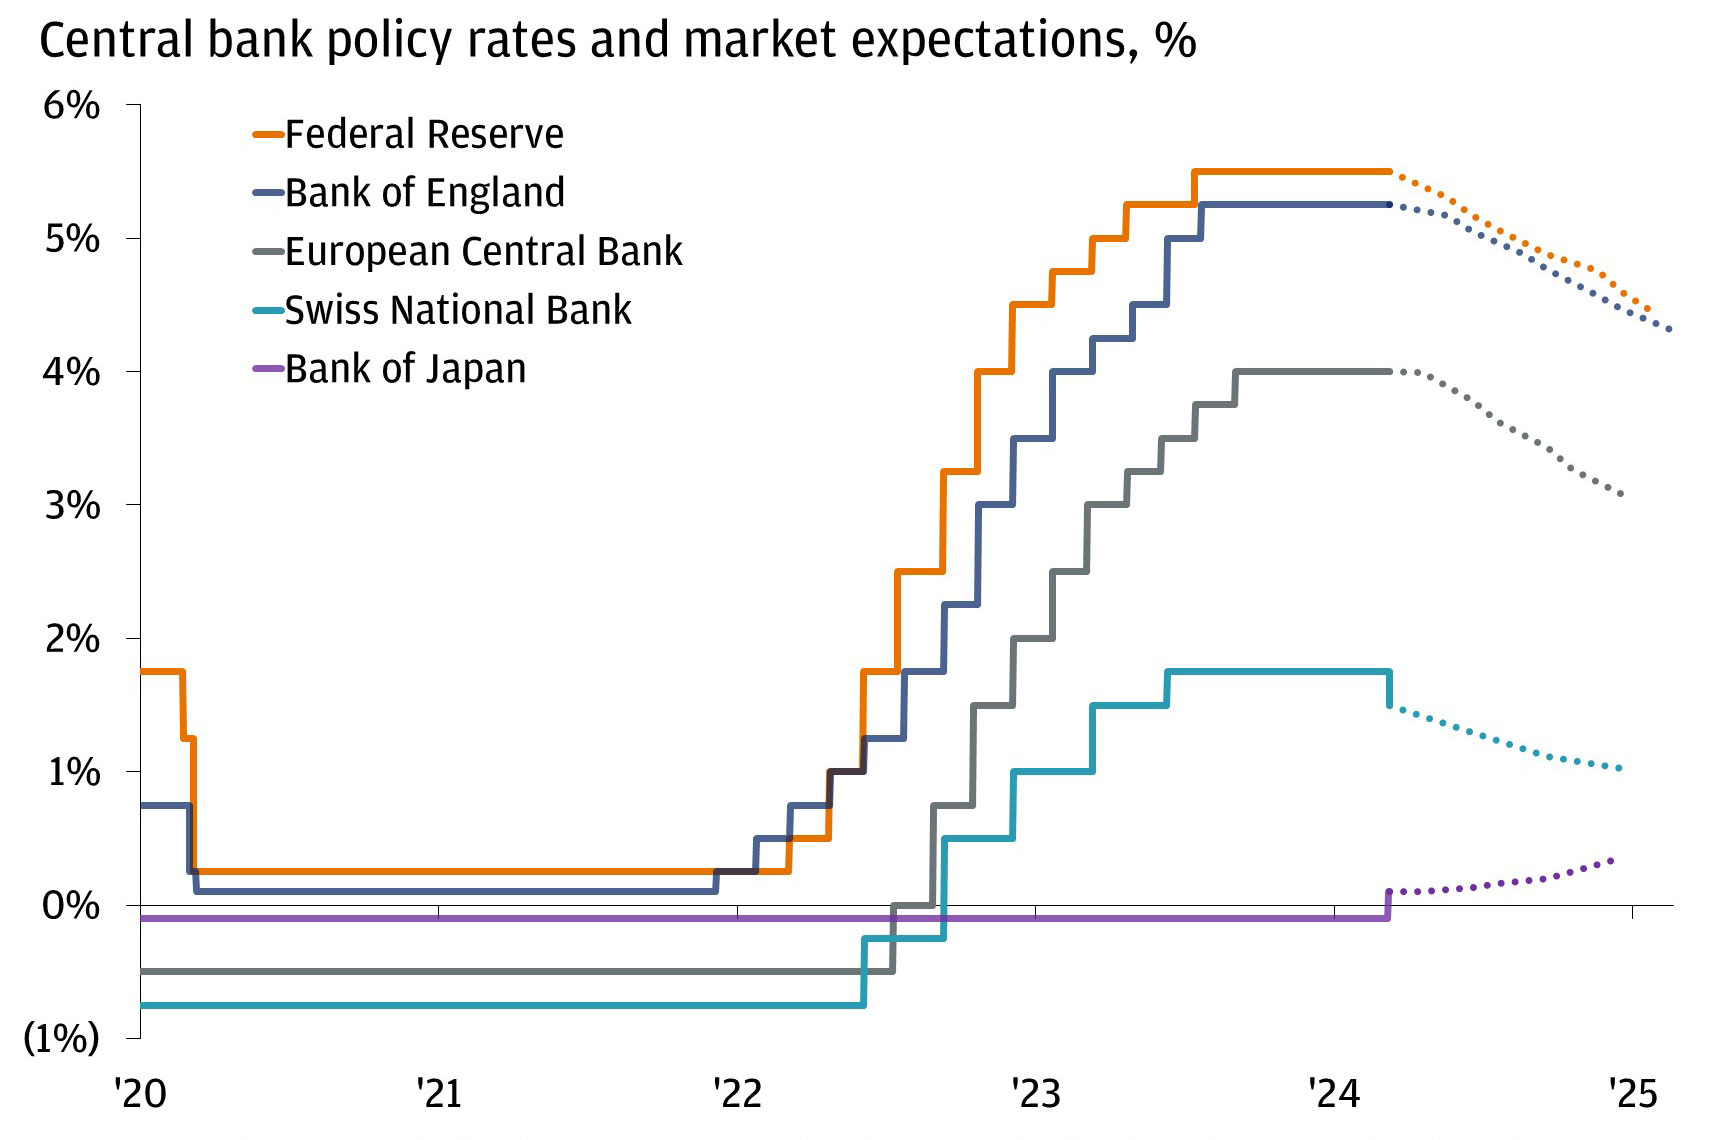
The Swiss National Bank (SNB) made history as the first developed market central bank to deliver a rate cut this cycle. The Federal Reserve confirmed that it still plans to cut rates three times this year, even with stronger growth and stickier inflation in mind. The Bank of England laid the groundwork for a potential cut as soon as June, with the United Kingdom “on the way” to winning its fight against inflation. Even the Bank of Japan made its own milestone, hiking rates for the first time in 17 years to officially put an end to the negative interest rate experiment.


In all, the race to lower rates is officially on – and the SNB just kicked it off.

Off to the races: rate cuts are on the way

This chart shows central bank policy rates and expectations, for the Federal Reserve, Bank of England, European Central Bank, Swiss National Bank, and the Bank of Japan.
Sources: Federal Reserve, Bank of England, European Central Bank, Swiss National Bank, Bank of Japan, Bloomberg Finance L.P. Data as of March 21, 2024. Note: Federal Reserve market expectations are based on Fed funds futures. All other expectations are calculated using overnight indexed swaps.
See expandable image , opens new browser window | Show text version, opens overlay

Policymakers aren’t as worried about inflation


The task of taming inflation without derailing growth has been a delicate one for central bankers. To make a long story short, policymakers signaled this week that they’re starting to focus more on the downside risks to economic activity from keeping rates high, rather than obsessing about inflation’s bumpy path back to 2% targets.


The Fed gave us a few updates to support this:


  • Fed Chair Powell stressed that, just as the central bank didn’t overreact to softer inflation prints last year, it’s not taking firmer readings over the last two months as a new trend either. These are inevitable “bumps in the road” in the disinflation process.
  • Powell made one meaningful change in his prepared statement from the January meeting: to add the idea that “an unexpected weakening in the labor market could…warrant a policy response.” While he said he doesn’t think that is likely, it suggests this the Fed is more inclined to cut than it is to hike.
  • The Fed signaled a stronger economy, bumping up its GDP growth and inflation projections, while also lowering its unemployment forecast. And yet, it still sees the three rate cuts this year it had before. How? The committee specifically called out “improving supply conditions” (especially in the labor market) as a key reason why stronger growth need not stoke more inflation. This signals that the Fed thinks the economy looks healthy, not too hot, and that rate cuts should remain on the table.


All told, the Fed – along with most of its global peers – seems more inclined to start cutting at the first sign of economic weakness than aggressively hiking if inflation takes a bit longer to return to target. That “asymmetry” in its decision-making is good news for multi-asset class investors.


Reinvestment risk is real: Rethink your cash


With rates higher for longer, investors haven’t felt incentivized to run out of cash. Now, with cuts in motion, those sitting on the sidelines should think about picking it up to a jog.


Consider the paths ahead. Let’s say that we avoid a recession and achieve a “soft landing.” In that scenario, riskier assets such as stocks should outperform. On the flip side, let’s say we do get that recession. Bonds can offer stability and a hedge against downside risks. Or, finally, let’s say inflation reaccelerates. As we saw in 2022, alternatives such as real assets can outperform – as well as offer access to long-term trends such as industrial policy and the energy transition.


It’s also worth noting that, even in a year like 2023, when cash offered some of the best yields in over a decade, it still underperformed most other asset classes: Rolling T-bills generated a 5.1% return compared to a 26% rally in U.S. stocks and a 8.5% return in U.S. investment grade bonds. As returns compound over time, this can lead to big differences.


So while cash has a purpose, and it can be a critical part of any investor’s plan, we’re reminded now more than ever that it comes with a cost. Just ask a deposit holder this week in Switzerland.


Stocks are marching higher as the rally broadens


Heading into Friday, the S&P 500 has made 20 new all-time highs so far this year. After a long two-year drought, this means 35% of 2024’s trading days have notched a new record. Better growth, moderate inflation and Fed easing are the “chef’s kiss” recipe for corporate profits, and, in turn, broader equity returns.


But as many lamented big tech’s leadership last year, this year is bringing a much broader trend: Year-to-date, over one-third of S&P 500 companies are actually beating the broader index’s 10.3% total return, and almost three-quarters are higher overall on the year.

The stock rally has been broadening out

This chart shows the performance of S&P 500 constituents year-to-date in percent.
Sources: Bloomberg Finance L.P. Data as of March 21, 2024. Past performance is no guarantee of future results. It is not possible to invest directly in an index.
See expandable image , opens new browser window | Show text version, opens overlay

The rally goes even broader than that. U.S. small and mid-caps have outperformed the S&P 500 since the lull we saw in markets in late October. Thirty-five out of 48 MSCI countries we track are higher on the year – and the United States ranks 14th. This calls to mind that markets in both Japan and Europe have also made their own all-time highs over the last few weeks.


Questions abound over whether sitting on the sidelines means you’ve “missed it.” With the potential for more gains ahead, we think the bigger risk is standing idle.


Bonds stand to up their game in portfolios


Over the last two years, bonds haven’t provided the diversification we’re used to. This has had a lot to do with inflation running at more than double of central bank targets. If risk assets came under pressure, it was a good chance it was because inflation was accelerating and central banks needed to get more and more aggressive. And with inflation that high, it also makes it really difficult for central banks to cut if they have to.


With inflation now steadily moving lower, we see bonds playing a renewed role in portfolios. Based on our analysis, we think inflation below 3% will likely enable the return of a favorable negative stock-bond correlation. At this point, central banks tend to be less constrained in their ability to respond to any negative economic or market shock, and the general public and market participants don’t typically see inflation as much as a problem.

After 20 years of a favorable stock-bond correlation, it flipped during the recent inflation shock

The chart describes rolling 5-year correlation between changes in P/E multiples and changes in 10-year Treasury bond prices.
Source: S&P, Robert Shiller. Data as of September 30, 2023. Positive correlation when stocks and bonds move in the same direction. Negative correlation when stocks and bonds move in different directions. Past performance is no guarantee of future results. It is not possible to invest directly in an index.
See expandable image , opens new browser window | Show text version, opens overlay

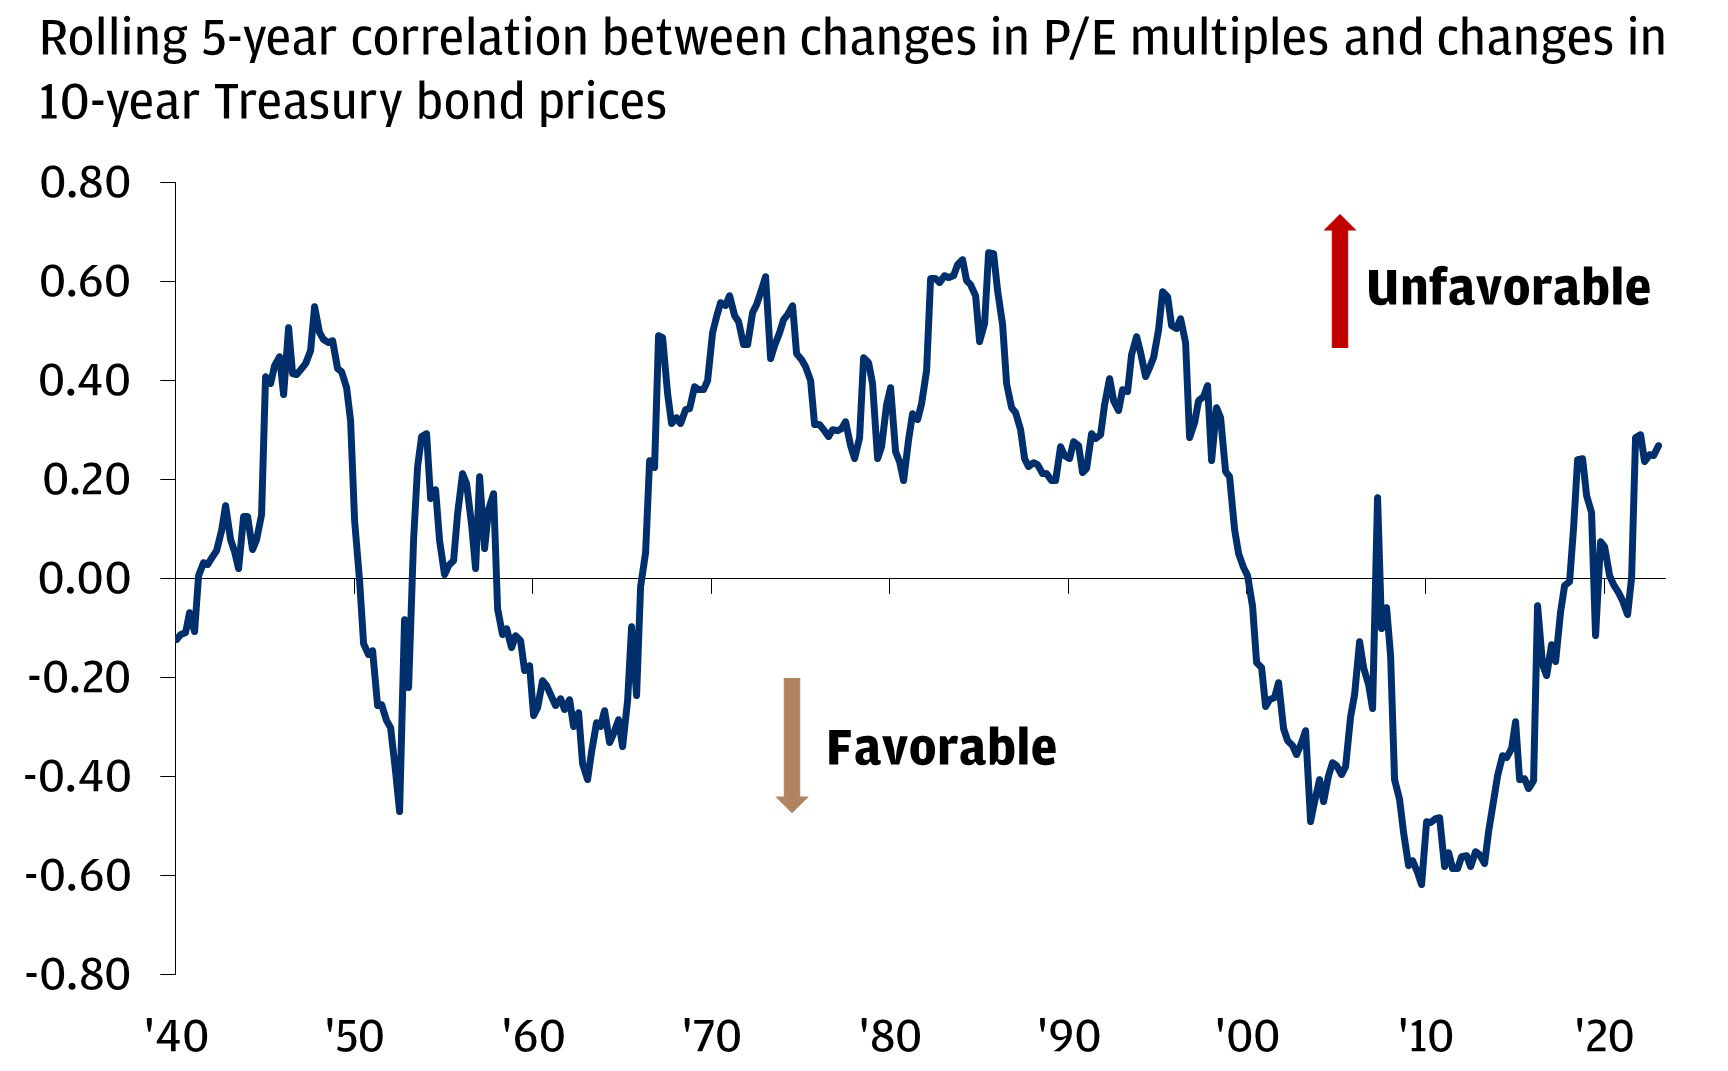
In our view, this strengthens the potential for portfolio diversification. Surveying the fixed income landscape today, we see tactical opportunity on the shorter-end of the curve (think: 2–3 years) as central banks kick off rate cuts, while we also continue to see strategic opportunity in longer duration for many investors that still need to right-size their portfolios.


Keep your goals top of mind


Cash comes with an opportunity cost. Take this week’s news as a sign to step back. Think again about how much liquidity you really need and how that fits into your long-term goals.


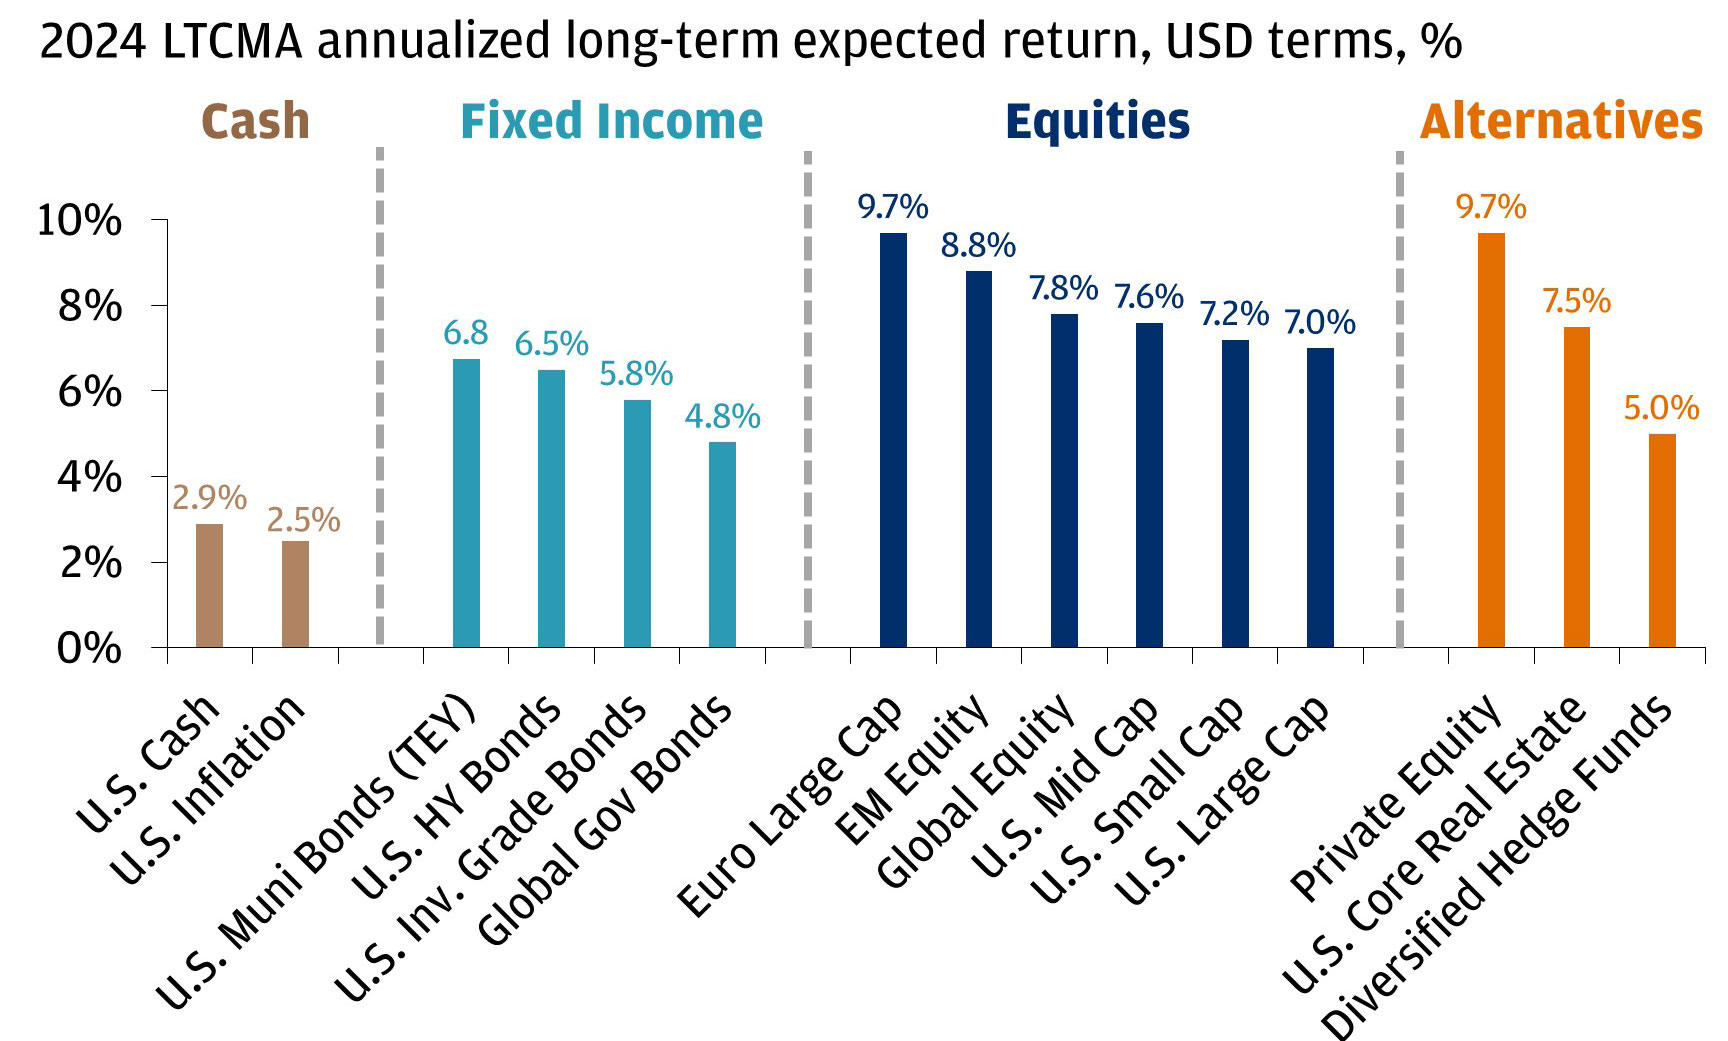
We think the tailwinds for a ripe investing landscape remain in place: Growth is resilient, disinflation is still on trend, earnings are growing and AI enthusiasm continues on. In our view, this continues to open up opportunities across asset classes, in both the short and long terms. Consider J.P. Morgan Asset Management’s Long Term Capital Market Assumptions, which scrutinize over 200 asset and strategy classes to provide return outlooks over a 10- to 15-year investment horizon. The punchline: Cash rates may be high today, but every major asset class stands to outperform cash over that investment horizon.

We see compelling opportunities outside of cash

This chart shows the 2024 LTCMA annualized long-term expected return across several asset classes.
Source: J.P. Morgan Asset Management - 2024 Long-term Capital Market Assumptions (LTCMAs). Projections are as of September 30, 2023. Note: U.S. Muni Bonds forecast as Tax Equivalent Yield (TEY). Tax calculation assumes highest federal income tax of 37% and a Medicare tax of 3.8%, excludes state and local taxes. Without a tax adjustment, U.S. Muni Bonds are forecast to return 4.0% by the LTCMAs. Outlooks and past performance are no guarantee of future results. It is not possible to invest directly in an index.
See expandable image , opens new browser window | Show text version, opens overlay

Your J.P. Morgan team can help you reassess how much cash you need and where excess capital might be deployed to reach your family’s goals.


All market and economic data as of 03/22/2024 are sourced from Bloomberg Finance L.P. and FactSet unless otherwise stated.

Invest your way

Not working with us yet? Find a J.P. Morgan Advisor or explore ways to invest online. 

Continue

You may also like

Top Market Takeaways

Article Top Market Takeaways Finding opportunity in increasing deficits

A new tax bill is poised to push the U.S. debt burden higher. Here’s what you can do to find opportunity.

By Alan Wynne
Top Market Takeaways

Article Top Market Takeaways How to protect your portfolio

The U.S. economy has faced increased risks to growth and inflation in 2025. Here’s how you can stay protected.

By Carter Griffin

Article Investment strategy Strategic liquidity in an ever-evolving market environment

In an ever-evolving market environment, diverse forms of liquidity are crucial for investors when it comes to staying prepared for the unexpected. Read on to learn more.

By Angelena Mascilli
3 min read

Invest your way

From online investing to working with an advisor, J.P. Morgan is ready to help you achieve your goals.

Continue, to investment offers page.

Disclosures

Our Top Market Takeaways for March 22nd, 2024.

Index definitions:

The STOXX Europe 600 Index (SXXP Index) is an index tracking 600 publicly traded companies based in one of 18 EU countries. The index includes small-cap, medium-cap, a...

Read more disclosures about this article

Our Top Market Takeaways for March 22nd, 2024.

Index definitions:

The STOXX Europe 600 Index (SXXP Index) is an index tracking 600 publicly traded companies based in one of 18 EU countries. The index includes small-cap, medium-cap, and large-cap companies. The countries represented in the index are Austria, Belgium, Denmark, Finland, France, Germany, Greece, Holland, Iceland, Ireland, Italy, Luxembourg, Norway, Portugal, Spain, Sweden, Switzerland and the United Kingdom.

Bloomberg Global EQ:FI 60:40 Index is designed to measure cross-asset market performance globally. The index rebalances monthly to 60% equities and 40% fixed income. The equities and fixed income are represented by Bloomberg Developed Markets Large & Mid Cap Total Return Index (DMTR) and Bloomberg Global Aggregate Index (LEGATRUU) respectively.

The CAC 40 is a benchmark French stock market index. The index represents a capitalization-weighted measure of the 40 most significant stocks among the 100 largest market caps on the Euronext Paris.

The Nikkei 225, or the Nikkei Stock Average, more commonly called the Nikkei or the Nikkei index, is a stock market index for the Tokyo Stock Exchange.

The Standard and Poor's Midcap 400, or simply the S&P Midcap 400, is a capitalization-weighted index which measures the performance of the mid-range sector of the U.S. stock market.

The Magnificent Seven stocks are a group of influential companies in the U.S. stock market: Alphabet, Amazon, Apple, Meta Platforms, Microsoft, NVIDIA, and Tesla.

The S&P 500 Equal Weight Index is the equal-weight version of the widely-used S&P 500. The index includes the same constituents as the capitalization weighted S&P 500, but each company is allocated a fixed weight - or 0.2% of the index total at each quarterly rebalance.

The Standard and Poor's 500, or simply the S&P 500, is a capitalization-weighted stock market index tracking the stock performance of 500 of the largest companies listed on stock exchanges in the United States.

Bonds are subject to interest rate risk, credit, call, liquidity and default risk of the issuer. Bond prices generally fall when interest rates rise.

The price of equity securities may rise or fall due to the changes in the broad market or changes in a company's financial condition, sometimes rapidly or unpredictably. Equity securities are subject to "stock market risk" meaning that stock prices in general may decline over short or extended periods of time.

The information presented is not intended to be making value judgments on the preferred outcome of any government decision or political election.

The S&P 500® is widely regarded as the best single gauge of large-cap U.S. equities and serves as the foundation for a wide range of investment products. The index includes 500 leading companies and captures approximately 80% coverage of available market capitalization.

Standard and Poor’s 500 Index is a capitalization-weighted index of 500 stocks. The index is designed to measure performance of the broad domestic economy through changes in the aggregate market value of 500 stocks representing all major industries. The index was developed with a base level of 10 for the 1941–43 base period.

The Bloomberg Eco Surprise Index shows the degree to which economic analysts under- or over-estimate the trends in the business cycle. The surprise element is defined as the percentage difference between analyst forecasts and the published value of economic data releases.

The MSCI World Index is a free float-adjusted market capitalization index that is designed to measure global developed market equity performance.

The NASDAQ 100 Index is a basket of the 100 largest, most actively traded U.S companies listed on the NASDAQ stock exchange. The index includes companies from various industries except for the financial industry, like commercial and investment banks. These non-financial sectors include retail, biotechnology, industrial, technology, health care, and others.

The Russell 2000 Index measures small company stock market performance. The index does not include fees or expenses.

We believe the information contained in this material to be reliable but do not warrant its accuracy or completeness. Opinions, estimates, and investment strategies and views expressed in this document constitute our judgment based on current market conditions and are subject to change without notice.

The views, opinions, estimates and strategies expressed herein constitutes the author's judgment based on current market conditions and are subject to change without notice, and may differ from those expressed by other areas of J.P. Morgan. This information in no way constitutes J.P. Morgan Research and should not be treated as such. You should carefully consider your needs and objectives before making any decisions. For additional guidance on how this information should be applied to your situation, you should consult your advisor.

All companies referenced are shown for illustrative purposes only, and are not intended as a recommendation or endorsement by J.P. Morgan in this context.

JPMorgan Chase & Co., its affiliates, and employees do not provide tax, legal or accounting advice. Information presented on these webpages is not intended to provide, and should not be relied on for tax, legal and accounting advice. You should consult your own tax, legal and accounting advisors before engaging in any financial transaction.

Given the complex risk-reward trade-offs involved, we advise clients to rely on judgment as well as quantitative optimization approaches in setting strategic allocations. Please note that all information shown is based on qualitative analysis. Exclusive reliance on the above is not advised. This information is not intended as a recommendation to invest in any particular asset class or strategy or as a promise of future performance. Note that these asset class and strategy assumptions are passive only – they do not consider the impact of active management. References to future returns are not promises or even estimates of actual returns a client portfolio may achieve. Assumptions, opinions and estimates are provided for illustrative purposes only. They should not be relied upon as recommendations to buy or sell securities. Forecasts of financial market trends that are based on current market conditions constitute our judgment and are subject to change without notice. We believe the information provided here is reliable, but do not warrant its accuracy or completeness. This material has been prepared for information purposes only and is not intended to provide, and should not be relied on for, accounting, legal or tax advice. The outputs of the assumptions are provided for illustration/discussion purposes only and are subject to significant limitations.

“Expected” or “alpha” return estimates are subject to uncertainty and error. For example, changes in the historical data from which it is estimated will result in different implications for asset class returns. Expected returns for each asset class are conditional on an economic scenario; actual returns in the event the scenario comes to pass could be higher or lower, as they have been in the past, so an investor should not expect to achieve returns similar to the outputs shown herein. References to future returns for either asset allocation strategies or asset classes are not promises of actual returns a client portfolio may achieve. Because of the inherent limitations of all models, potential investors should not rely exclusively on the model when making a decision. The model cannot account for the impact that economic, market, and other factors may have on the implementation and ongoing management of an actual investment portfolio. Unlike actual portfolio outcomes, the model outcomes do not reflect actual trading, liquidity constraints, fees, expenses, taxes and other factors that could impact the future returns. The model assumptions are passive only – they do not consider the impact of active management. A manager’s ability to achieve similar outcomes is subject to risk factors over which the manager may have no or limited control.

The views contained herein are not to be taken as advice or a recommendation to buy or sell any investment in any jurisdiction, nor is it a commitment from J.P. Morgan Asset Management or any of its subsidiaries to participate in any of the transactions mentioned herein. Any forecasts, figures, opinions or investment techniques and strategies set out are for information purposes only, based on certain assumptions and current market conditions and are subject to change without prior notice. All information presented herein is considered to be accurate at the time of production. This material does not contain sufficient information to support an investment decision and it should not be relied upon by you in evaluating the merits of investing in any securities or products. In addition, users should make an independent assessment of the legal, regulatory, tax, credit and accounting implications and determine, together with their own financial professional, if any investment mentioned herein is believed to be appropriate to their personal goals. Investors should ensure that they obtain all available relevant information before making any investment. It should be noted that investment involves risks, the value of investments and the income from them may fluctuate in accordance with market conditions and taxation agreements and investors may not get back the full amount invested. Both past performance and yield are not a reliable indicator of current and future results.

Risk considerations:

  • Past performance is not indicative of future results. You may not invest directly in an index.
  • The price of equity securities may rise or fall due to the changes in the broad market or changes in a company's financial condition, sometimes rapidly or unpredictably. Equity securities are subject to 'stock market risk' meaning that stock prices in general may decline over short or extended periods of time.
  • Investing in fixed income products subject to certain risks, including interest rate, credit, inflation, call, prepayment and reinvestment risk. Any fixed income security sold or redeemed prior to maturity may be subject to substantial gain or loss.
  • In general, the bond market is volatile and bond prices rise when interest rates fall and vice versa. Longer term securities are more prone to price fluctuation than shorter term securities. Any fixed income security sold or redeemed prior to maturity may be subject to substantial gain or loss. Dependable income is subject to the credit risk of the issuer of the bond. If an issuer defaults no future income payments will be made.
  • When investing in mutual funds or exchange-traded and index funds, please consider the investment objectives, risks, charges, and expenses associated with the funds before investing. You may obtain a fund’s prospectus by contacting your investment professional. The prospectus contains information, which should be carefully read before investing.
  • Investors should understand the potential tax liabilities surrounding a municipal bond purchase. Certain municipal bonds are federally taxed if the holder is subject to alternative minimum tax. Capital gains, if any, are federally taxable. The investor should note that the income from tax-free municipal bond funds may be subject to state and local taxation and the Alternative Minimum Tax (AMT).
  • International investments may not be suitable for all investors. International investing involves a greater degree of risk and increased volatility. Changes in currency exchange rates and differences in accounting and taxation policies outside the U.S. can raise or lower returns. Some overseas markets may not be as politically and economically stable as the United States and other nations. Investments in international markets can be more volatile.
  • Investments in emerging markets may not be suitable for all investors. Emerging markets involve a greater degree of risk and increased volatility. Changes in currency exchange rates and differences in accounting and taxation policies outside the U.S. can raise or lower returns. Some overseas markets may not be as politically and economically stable as the United States and other nations. Investments in emerging markets can be more volatile.
  • Investments in commodities may have greater volatility than investments in traditional securities, particularly if the instruments involve leverage. The value of commodity-linked derivative instruments may be affected by changes in overall market movements, commodity index volatility, changes in interest rates, or factors affecting a particular industry or commodity, such as drought, floods, weather, livestock disease, embargoes, tariffs and international economic, political and regulatory developments. Use of leveraged commodity-linked derivatives creates an opportunity for increased return but, at the same time, creates the possibility for greater loss.
  • Real Estate Investments Trusts may be subject to a high degree of market risk because of concentration in a specific industry, sector or geographical sector. Real estate investments may be subject to risks including, but not limited to, declines in the value of real estate, risks related to general and economic conditions, changes in the value of the underlying property owned by the trust and defaults by borrower.
  • Investment in alternative strategies is speculative, often involves a greater degree of risk than traditional investments including limited liquidity and limited transparency, among other factors and should only be considered by sophisticated investors with the financial capability to accept the loss of all or part of the assets devoted to such strategies.
  • Structured products involve derivatives and risks that may not be suitable for all investors. The most common risks include, but are not limited to, risk of adverse or unanticipated market developments, issuer credit quality risk, risk of lack of uniform standard pricing, risk of adverse events involving any underlying reference obligations, risk of high volatility, risk of illiquidity/little to no secondary market, and conflicts of interest. Before investing in a structured product, investors should review the accompanying offering document, prospectus or prospectus supplement to understand the actual terms and key risks associated with the each individual structured product. Any payments on a structured product are subject to the credit risk of the issuer and/or guarantor. Investors may lose their entire investment, i.e., incur an unlimited loss. The risks listed above are not complete. For a more comprehensive list of the risks involved with this particular product, please speak to your J.P. Morgan team.
  • As a reminder, hedge funds (or funds of hedge funds) often engage in leveraging and other speculative investment practices that may increase the risk of investment loss. These investments can be highly illiquid, and are not required to provide periodic pricing or valuation information to investors, and may involve complex tax structures and delays in distributing important tax information. These investments are not subject to the same regulatory requirements as mutual funds; and often charge high fees. Further, any number of conflicts of interest may exist in the context of the management and/or operation of any such fund. For complete information, please refer to the applicable offering memorandum.
  • For informational purposes only -- J.P. Morgan Securities LLC does not endorse, advise on, transmit, sell or transact in any type of virtual currency. PLEASE NOTE: JPMorgan Securities LLC does not intermediate, mine, transmit, custody, store, sell, exchange, control, administer, or issue any type of virtual currency, which includes any type of digital unit used as a medium of exchange or a form of digitally stored value.
  • The prices and rates of return are indicative, as they may vary over time based on market conditions.
  • Additional risk considerations exist for all strategies.
  • The information provided herein is not intended as a recommendation of or an offer or solicitation to purchase or sell any investment product or service.
  • Opinions expressed herein may differ from the opinions expressed by other areas of J.P. Morgan. This material should not be regarded as investment research or a J.P. Morgan investment research report.
Show Less