Start of the overlay
Image description

BCOM index level


This chart shows the Bloomberg commodities index price level, from January 6, 2010, until March 1, 2022. The first data point came in at 145 in January 6, 2010. From here, the index dropped to a trough of 122 by June 4, 2010. Then, it rose to an all-time high of 175.4 on April 29, 2011. From there, the index declined to 126.8 by June 1, 2012. Here, it rapidly rose to 152 by September 14, 2012. From there, it gradually declined to 122.3 on January 9, 2014. Then, it rose to a relative peak of 138.7 on April 29, 2014. Here, it dropped to a trough of 72.9 by January 20, 2016. Then, it rose to 89.9 by June 8, 2016. Here, it declined a bit before rising to 89.4 by February 10, 2017. Then, it declined again to 79.4, before rising to another relative peak of 90.5 by April 18, 2018. From there, it gradually declined to 81.6 by January 6, 2020. Here, it dropped to an all-time low of 59.6 by April 27, 2020. From there, it rose to a relative peak of 105.8 by October 25, 2021, before settling down at 95.5 on December 15, 2021. From there until recently, it rose to 119.29 by March 1, 2022.

End of the overlay

Top Market Takeaways Quick shot: The energy market is under pressure

Published Mar 03, 2022
The Know Top Market Takeaways

The Bloomberg commodities index tracks prices of a basket of commodities (think of oil, natural gas, corn, wheat, copper, gold, and so forth). And, lately, prices have been soaring. Let’s break it down.


Russia produces ~12% of the world’s oil and ~17% of natural gas, while Ukraine exports ~13% of global corn and ~12% of wheat. Since the start of last week, prices skyrocketed. Oil prices, for instance, rallied and WTI is now trading above $111/barrel for the first time since 2011 and the Bloomberg Commodity Index had its largest rally since 2009 yesterday.


So, what’s the issue with higher prices? Well, 40% of Europe’s natural gas and 27% of its oil comes from Russia, and 30% of that energy is transported through Ukrainian territory. The United States, on the other hand, imports just 1%-3% of its oil and gas from Russia. Thus, it seems like higher energy prices will be harder on Europeans than they will be on Americans.


High energy prices could keep inflation high, making it even harder for central banks as they seek to promote economic growth.

COMMODITIES CONTINUE THEIR CLIMB

Line graph of BCOM index level
Source: Bloomberg Finance L.P. Data is as of March 1, 2022.
See expandable image , opens new browser window | Show text version, opens overlay

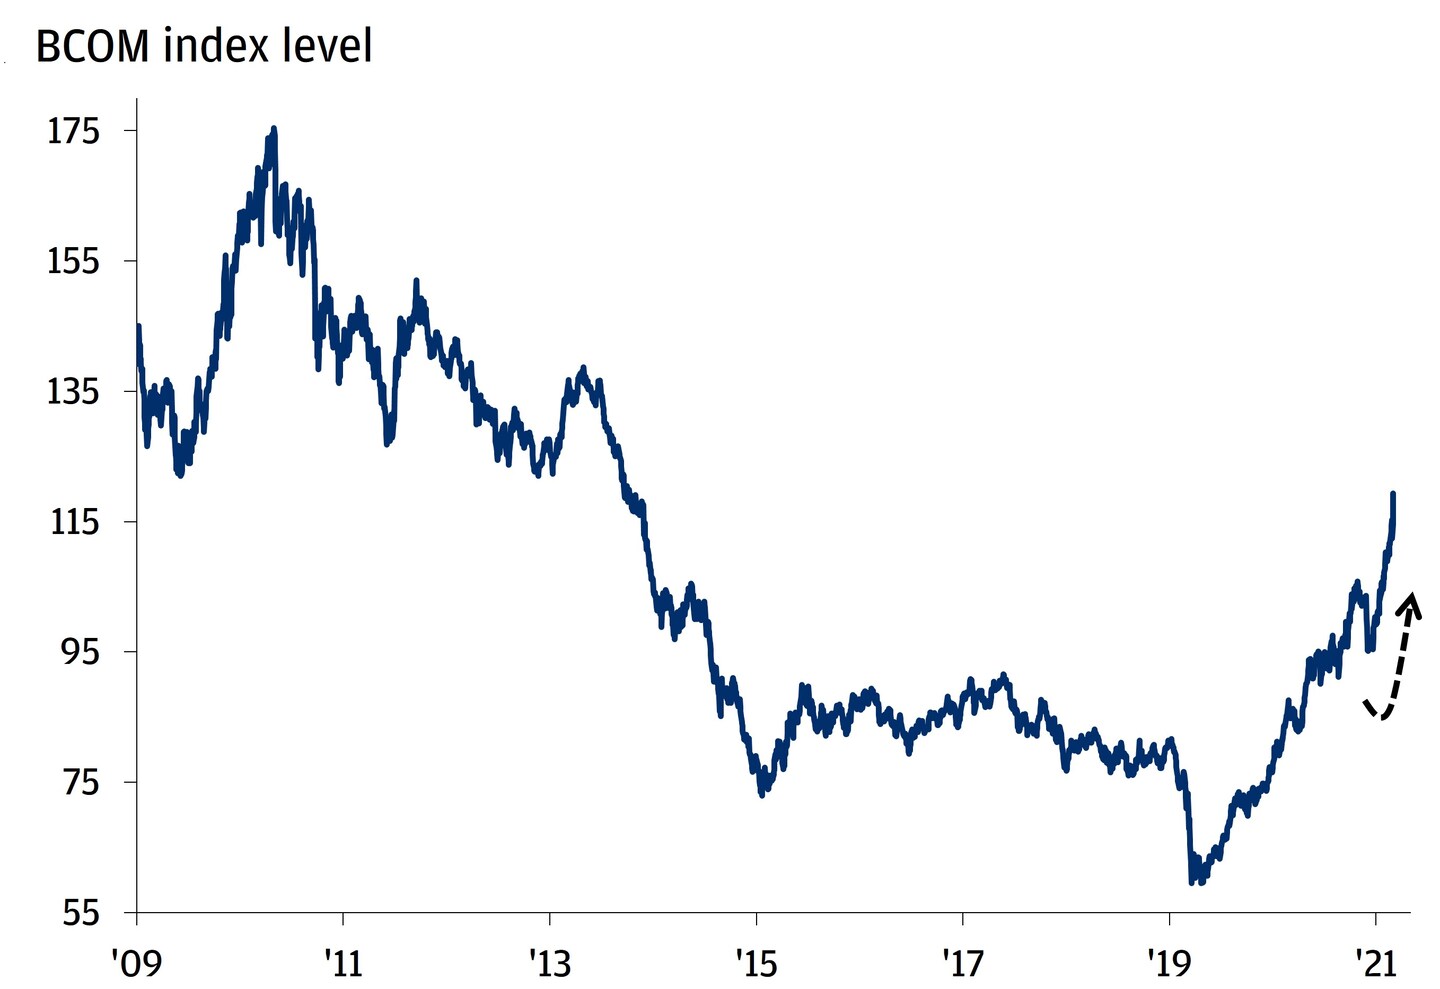
All market data from Bloomberg Finance L.P., 3/2/22.

Invest your way

Not working with us yet? Find a J.P. Morgan Advisor or explore ways to invest online. 

Continue

You may also like

Top Market Takeaways

Article Top Market Takeaways Differentiating large from small: Firm size and exposure to trade tensions

With tariffs likely to settle at elevated rates, we explore how company size may shape the impact

By Vinny Amaru

Article Economic outlook July 2025 Fed meeting: Rates hold steady once again, potentially setting up fall intrigue

The Federal Reserve held rates steady once again in July, but the decision wasn’t unanimous. What could that mean for economic policy going forward?

By Seth Carlson
3 min read
Top Market Takeaways

Article Top Market Takeaways Reflections from the Road: The AI investment case and the potential impacts on the economy

The development of the artificial intelligence ecosystem is one of the key investment themes we've been emphasizing this year.

By Vinny Amaru

Invest your way

From online investing to working with an advisor, J.P. Morgan is ready to help you achieve your goals.

Continue, to investment offers page.

Disclosures

Our Top Market Takeaways for March 2nd, 2022.

All companies referenced are shown for illustrative purposes only, and are not intended as a recommendation or endorsement by J.P. Morgan in this context.

Not all option strategies are suitable for all i...

Read more disclosures about this article

Our Top Market Takeaways for March 2nd, 2022.

All companies referenced are shown for illustrative purposes only, and are not intended as a recommendation or endorsement by J.P. Morgan in this context.

Not all option strategies are suitable for all investors. Certain strategies may expose investors to significant potential risks and losses. For additional risk information, please read the “Characteristics and Risks of Standardized Options”. We advise investors to consult their tax advisors and legal counsel about the tax implications of these strategies. Investors are urged to carefully consider whether options or option-related products or strategies are suitable for their needs.

All market and economic data as of March 2022 and sourced from Bloomberg and FactSet unless otherwise stated.

We believe the information contained in this material to be reliable but do not warrant its accuracy or completeness. Opinions, estimates, and investment strategies and views expressed in this document constitute our judgment based on current market conditions and are subject to change without notice.

RISK CONSIDERATIONS

  • Past performance is not indicative of future results. You may not invest directly in an index.
  • The prices and rates of return are indicative, as they may vary over time based on market conditions.
  • Additional risk considerations exist for all strategies.
  • The information provided herein is not intended as a recommendation of or an offer or solicitation to purchase or sell any investment product or service.
  • Opinions expressed herein may differ from the opinions expressed by other areas of J.P. Morgan. This material should not be regarded as investment research or a J.P. Morgan investment research report.

The views, opinions, estimates and strategies expressed herein constitutes the author's judgment based on current market conditions and are subject to change without notice, and may differ from those expressed by other areas of J.P. Morgan. This information in no way constitutes J.P. Morgan Research and should not be treated as such. You should carefully consider your needs and objectives before making any decisions. For additional guidance on how this information should be applied to your situation, you should consult your advisor.

In general, the bond market is volatile and bond prices rise when interest rates fall and vice versa. Longer term securities are more prone to price fluctuation than shorter term securities. Any fixed income security sold or redeemed prior to maturity may be subject to substantial gain or loss. Dependable income is subject to the credit risk of the issuer of the bond. If an issuer defaults no future income payments will be made.

The price of equity securities may rise or fall due to the changes in the broad market or changes in a company's financial condition, sometimes rapidly or unpredictably. Equity securities are subject to 'stock market risk' meaning that stock prices in general may decline over short or extended periods of time.

International investments may not be suitable for all investors. International investing involves a greater degree of risk and increased volatility. Changes in currency exchange rates and differences in accounting and taxation policies outside the U.S. can raise or lower returns. Some overseas markets may not be as politically and economically stable as the United States and other nations. Investments in international markets can be more volatile.

Show Less