Start of the overlay
Image description

Earnings per share year-over-year growth and expectations, percentage


The chart is a bar graph of quarterly earnings per share growth on a year-over-year as a percentage starting in the fourth quarter of 2013 and ending with expected earnings growth in the fourth quarter of 2024.


The first data point in the chart is for year-over-year earnings growth up 11% from the prior in the fourth quarter of 2013. The chart doesn’t change much but begins trending downward and dips to -1% for a year-over-year earnings decline in the second quarter of 2015. The chart moves neutral before continuing to fall further with year-over-year earnings declining by -6% in the first quarter of 2016. From here year-over-year earnings growth begins to rise with earnings 15% from the prior year in the first quarter of 2017. The chart continues to trend upward with year-over-year earnings growth at 27% in the third quarter of 2018. The chart begins trending lower from this point with year-over-year earnings declining to a growth rate of 1% in the first quarter of 2019 and eventually drastically falling to a decline of -34% from the prior year in the second quarter of 2020. From here, year-over-year earnings begin trending up eventually skyrocketing to a growth rate of 59% from the prior year in the second quarter of 2021. The year-over-year earnings growth rate remains positive before turning negative with a decline of -3% in the fourth quarter of 2022. The chart then shows the expected earnings growth per share rate with an expected decline of -7% in the second quarter of 2023. From here, the expected earnings per share growth rate turns positive all the way through the last data point which is an expected 13% growth rate from the prior year in the fourth quarter of 2024.

End of the overlay

Top Market Takeaways Quick shot: How you doin'?

Ajene Oden

Global Investment Strategist

Published Jul 14, 2023
Top Market Takeaways Quick Shots

Banks, margins and the consumer: We think these are the three key things to monitor throughout the second quarter earnings season.


While we don’t see the banks as in the hot seat like they were in the first quarter of this year, we do think of them as a sort of bellwether for the economy as they provide insight into the consumer and credit conditions. Credit is like oxygen for the economy, and right now the Fed is trying to slow the amount of oxygen in order to cool the still-burning fire of inflation. Bright side, the U.S. is trending closer to the Fed’s 2% inflation target as of the most recent Consumer Price Index (CPI) from June which came in at 3%.


Now, how about them margins? Well, margins help investors assess profitability. Said differently, they help us understand how companies are managing revenues versus costs. Broad market consensus is for Q2 earnings to contract by roughly -7% from the prior year. While we expect earnings to be down this quarter, we believe that margins will hold up better than expectations, propelled by prudent expense discipline and pricing power from various companies.


As for the consumer? This is a consumer-driven economy. Consumer spending makes up about 70% of U.S. Gross Domestic Product (GDP). During earnings season, corporate CEOs host earnings calls and provide forward guidance on the coming 12 months. These calls can help investors understand how the business world is viewing the strength of the consumer. A consensus that the consumer is strong or a positive outlook on the economy may mean that growth is on the horizon.


The market seems high on optimism lately, but earnings are still expected to have contracted in the second quarter. We’ll be watching carefully as the earnings season unfolds but believe the upbeat nature in markets may be warranted – we think the results could surprise to the upside.

Markets expect a Q2 contraction but growth ahead

This bar graph shows quarterly earnings per share growth on a year-over-year
Source: Morgan Stanley, FactSet. Data as of July 7, 2023. 
See expandable image , opens new browser window | Show text version, opens overlay

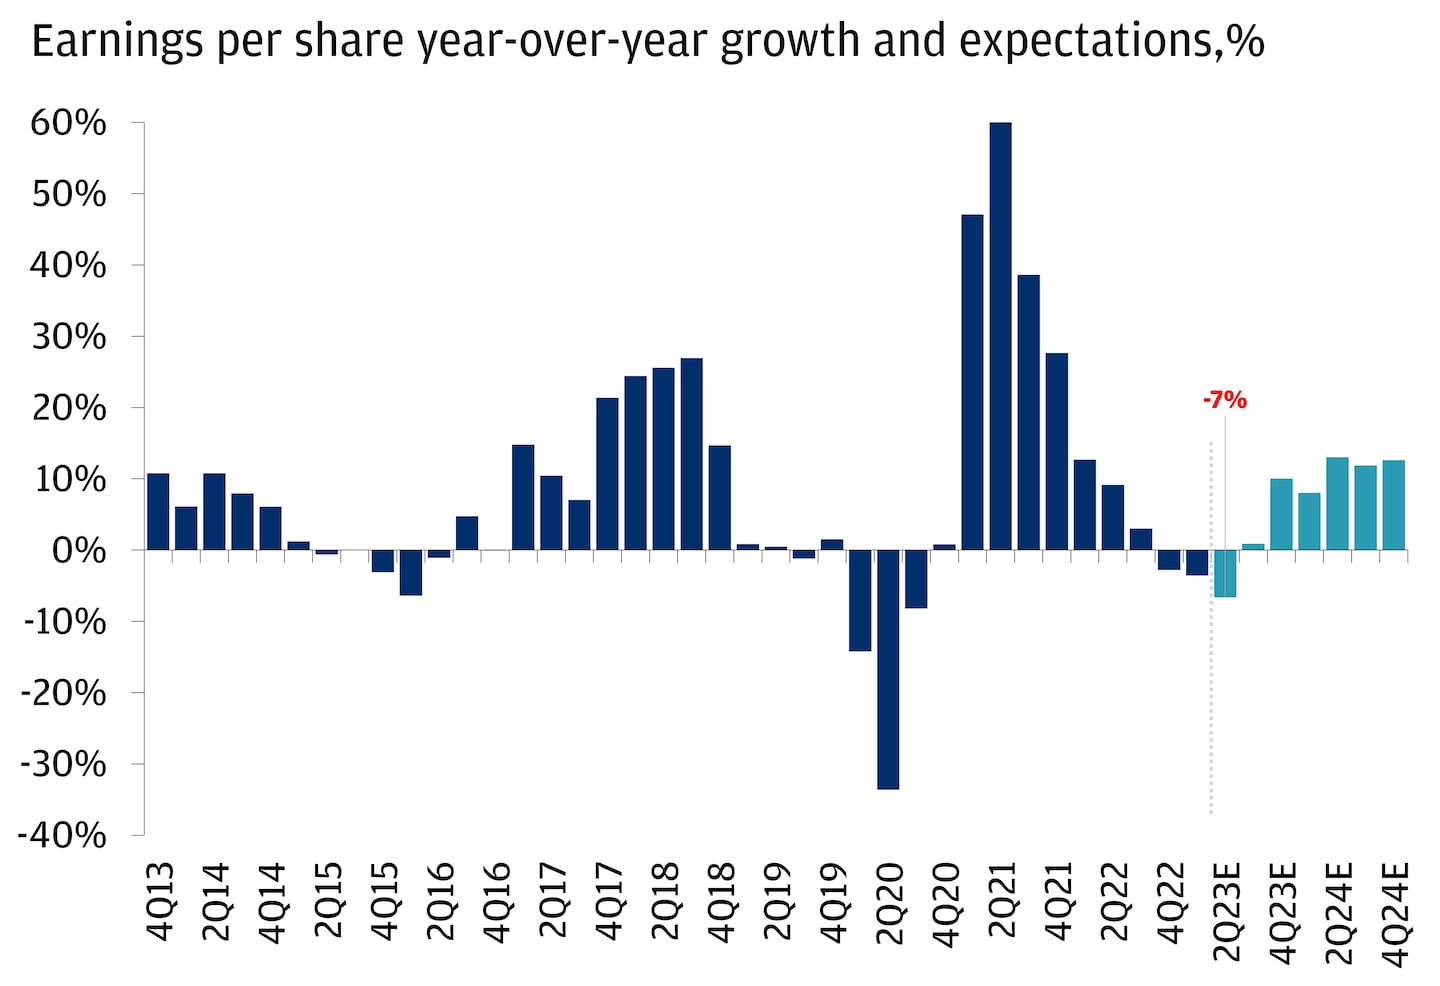
All market data from Bloomberg Finance L.P., 7/13/23.

Invest your way

Not working with us yet? Find a J.P. Morgan Advisor or explore ways to invest online. 

Continue

Ajene Oden

Global Investment Strategist

AJ Oden is a Global Investment Strategist for J.P. Morgan’s Global Investment Strategy team. AJ, in partnership with asset class leaders and the Chief Investment Officer and team, is responsible for developing and communicating the firm’ ...More

AJ Oden is a Global Investment Strategist for J.P. Morgan’s Global Investment Strategy team. AJ, in partnership with asset class leaders and the Chief Investment Officer and team, is responsible for developing and communicating the firm’s economic and market views and investment strategies to advisors and clients.


Prior to joining J.P. Morgan, AJ was a Senior Investment Strategist and official spokesperson for BNY Mellon Investor Solutions, with media appearances on CNBC, Bloomberg and Yahoo Finance. He was also a member of the investment team, helping to craft the business’s investment views. Like in his current role, AJ was responsible for providing market views and asset allocation insight to clients.


Before becoming an investment strategist, AJ worked in various BNY Mellon businesses including asset servicing, capital markets and relationship management. He was also a member of BNY Mellon’s associate rotational program.


AJ has a Bachelor of Science degree in marketing from Champlain College.

Less

You may also like

Top Market Takeaways

Article Top Market Takeaways Shock absorption: 3 signs the economy is picking up from here

Thanks to a few “shock absorbers,” we expect the economy to grow steadily after the latest rate cut.

By Federico Cuevas

Article Economic outlook December 2025 Fed meeting recap: Interest rates cut once more, but risks remain on the path to future policy

The Federal Reserve cut interest rates in December for a third consecutive time. Here’s what the decision, market reaction and updated outlook could mean for investors in 2026.

By Seth Carlson
5 min read
Top Market Takeaways

Article Top Market Takeaways 3 themes that defined portfolios in 2025 and could continue to shape them in 2026

As the end of the year approaches, we review three key factors that have shaped the investment landscape and consider the implications for the year ahead.

By Carter Griffin

Invest your way

From online investing to working with an advisor, J.P. Morgan is ready to help you achieve your goals.

Continue, to investment offers page.

Disclosures

Our Top Market Takeaways for July 14th, 2023.

All companies referenced are shown for illustrative purposes only, and are not intended as a recommendation or endorsement by J.P. Morgan in this context.

Not all option strategies are suitable for all investo...

Read more disclosures about this article

Our Top Market Takeaways for July 14th, 2023.

All companies referenced are shown for illustrative purposes only, and are not intended as a recommendation or endorsement by J.P. Morgan in this context.

Not all option strategies are suitable for all investors. Certain strategies may expose investors to significant potential risks and losses. For additional risk information, please read the “Characteristics and Risks of Standardized Options”. We advise investors to consult their tax advisors and legal counsel about the tax implications of these strategies. Investors are urged to carefully consider whether options or option-related products or strategies are suitable for their needs.

Diversification does not ensure a profit or protect against loss.

Standard and Poor’s 500 Index is a capitalization-weighted index of 500 stocks. The index is designed to measure performance of the broad domestic economy through changes in the aggregate market value of 500 stocks representing all major industries. The index was developed with a base level of 10 for the 1941–43 base period.

Standard and Poor’s 500 Information Technology Index comprises those companies included in the S&P 500 that are classified as members of the GICS information technology sector.

The Nasdaq-100 is a stock market index made up of 101 equity securities issued by 100 of the largest non-financial companies listed on the Nasdaq stock market. It is a modified capitalization-weighted index. The stocks' weights in the index are based on their market capitalizations, with certain rules capping the influence of the largest components.

The STOXX Europe 600 Index (SXXP Index) is an index tracking 600 publicly traded companies based in one of 18 EU countries. The index includes small-cap, medium-cap, and large-cap companies. The countries represented in the index are Austria, Belgium, Denmark, Finland, France, Germany, Greece, Holland, Iceland, Ireland, Italy, Luxembourg, Norway, Portugal, Spain, Sweden, Switzerland and the United Kingdom.

Small capitalization companies typically carry more risk than well-established "blue-chip" companies since smaller companies can carry a higher degree of market volatility than most large cap and/or blue-chip companies.​

All market and economic data as of July 2023 and sourced from Bloomberg and FactSet unless otherwise stated.

We believe the information contained in this material to be reliable but do not warrant its accuracy or completeness. Opinions, estimates, and investment strategies and views expressed in this document constitute our judgment based on current market conditions and are subject to change without notice.

RISK CONSIDERATIONS

  • Past performance is not indicative of future results. You may not invest directly in an index.
  • The prices and rates of return are indicative, as they may vary over time based on market conditions.
  • Additional risk considerations exist for all strategies.
  • The information provided herein is not intended as a recommendation of or an offer or solicitation to purchase or sell any investment product or service.
  • Opinions expressed herein may differ from the opinions expressed by other areas of J.P. Morgan. This material should not be regarded as investment research or a J.P. Morgan investment research report.

The views, opinions, estimates and strategies expressed herein constitutes the author's judgment based on current market conditions and are subject to change without notice, and may differ from those expressed by other areas of J.P. Morgan. This information in no way constitutes J.P. Morgan Research and should not be treated as such. You should carefully consider your needs and objectives before making any decisions. For additional guidance on how this information should be applied to your situation, you should consult your advisor.

Investors should understand the potential tax liabilities surrounding a municipal bond purchase. Certain municipal bonds are federally taxed if the holder is subject to alternative minimum tax. Capital gains, if any, are federally taxable. The investor should note that the income from tax-free municipal bond funds may be subject to state and local taxation and the Alternative Minimum Tax (AMT).

In general, the bond market is volatile and bond prices rise when interest rates fall and vice versa. Longer term securities are more prone to price fluctuation than shorter term securities. Any fixed income security sold or redeemed prior to maturity may be subject to substantial gain or loss. Dependable income is subject to the credit risk of the issuer of the bond. If an issuer defaults no future income payments will be made.

The price of equity securities may rise or fall due to the changes in the broad market or changes in a company's financial condition, sometimes rapidly or unpredictably. Equity securities are subject to 'stock market risk' meaning that stock prices in general may decline over short or extended periods of time.

International investments may not be suitable for all investors. International investing involves a greater degree of risk and increased volatility. Changes in currency exchange rates and differences in accounting and taxation policies outside the U.S. can raise or lower returns. Some overseas markets may not be as politically and economically stable as the United States and other nations. Investments in international markets can be more volatile.

Show Less