Start of the overlay
Image description

52 WEEK HIGH INDEX AND AVERAGE STOCK


Percent from 52-week high (%)


This chart shows the percent from the 52-week high for the S&P 500, NASDAQ 100, NASDAQ Composite, Russell 2000 (small cap), and the average stock within each index, by January 20, 2022. The percent from the 52-week high was -7.0% for the S&P 500 and -15.2% for the average stock, -11.4% for the NASDAQ 100 and -22.6% for the average stock, -12.7% for the NASDAQ Composite and -43.6% for the average stock, and -17.7% for the Russell 200 and -37.8% for the average stock.

End of the overlay
Start of the overlay
Image description

Volatility is normal – don’t let it derail your plans


S&P 500 intra-year declines (max drawdowns) & calendar year returns


This chart shows the S&P 500 calendar year returns and maximum intra-year drawdowns from 1980 to 2021. In 1980, the full year return was 26% and the maximum intra-year drawdown was -9%. In 1981, -10% and -18%, respectively. In 1982, 15% and -17%. In 1983, 17% and -7%. In 1984, 1% and -13%. In 1985, 26% and -8%. In 1986, 15% and -9%. In 1987, 2% and -34%. In 1988, 12% and -8%. In 1989, 27% and -8%. In 1990, -7% and -20%. In 1991, 26% and -6%. In 1992, 4% and -6%. In 1993, 7% and -5%. In 1994, -2% and -9%. In 1995, 34% and -3%. In 1996, 20% and -8%. In 1997, 31% and -11%. In 1998, 27% and -19%. In 1999, 20% and -12%. In 2000, -10% and -17%. In 2001, -13% and -30%. In 2002, -23% and -34. In 2003, 26% and -14%. In 2004, 9% and -8%. In 2005, 3% and -7%. In 2006, 14% and -8%. In 2007, 4% and -10%. In 2008, -38% and -49%, all-time lows. In 2009, 23% and -28%. In 2010, 13% and -16%. In 2011, 0% and -19%. In 2012, 13% and -10%. In 2013, 30% and -6%. In 2014, 11% and -7%. In 2015, -1% and -12%. In 2016, 10% and -11%. In 2017, 19% and -3%. In 2018, -6% and -20%. In 2019, 29% and -7%. In 2020, 16% and -34%. Finally, in 2021, 27% and -5%.

End of the overlay
Start of the overlay
Image description

2-YEAR TREASURY YIELDS AND THE FED FUNDS RATE


%


This chart shows the 2-year Treasury yields and the Fed Funds rate from 2000 to January 2022. In 2000, Feds fund rate began at 6.3%, rising to a series high of 6.9% by mid-May 2000. It fell from here, reaching 2.3% by early November 2001. It rose to 3.7% by April 2002 before falling to 1.1% by mid-June 2003. It rose again to 2.9% in late June 2004 and 5.2% in late June 2006. It fell at this point to 4.5% by early December 2006, rose slightly to 5.1% by mid-June 2007 before falling to 1.3% by mid-March 2008. It rose sharply to 3.0% by mid-June 2008. It dramatically fell to 0.6% by mid-December 2008. At this point, it remained relatively stable, reaching 0.3% by early November 2010, 0.2% by early May 2013. It rose steadily to 1.0% by January 2016, and 3.0% by November 2018. At this point, it fell to 1.4% by mid-February 2020, and 0.2% by late April 2020. It remained steady until early June 2021 when it picked up. 2-year yields landed at 1.05% by January 20, 2022.

Meanwhile, the Fed funds rate began at 5.5%, climbing to 6.5% by late October 2000. At this point, the rate was cut 13 times to land at 1% by the end of May 2003. It bottomed here, rising to 5.25% by late May 2006. By mid-July 2007, it began to falling, reaching 0.25% by mid-October 2008. It maintained this rate until mid-August 2015 when the Fed began liftoff. It rose to 2.5% by September 2018 - experiencing 9 hikes along the way. It fell in early April 2019, landing at 0.25%. This rate is maintained as of January 20, 2022.

End of the overlay

Top Market Takeaways There’s been a stock market sell-off—now what?

Updated Jan 21, 2022

Market update: A rough start to the year

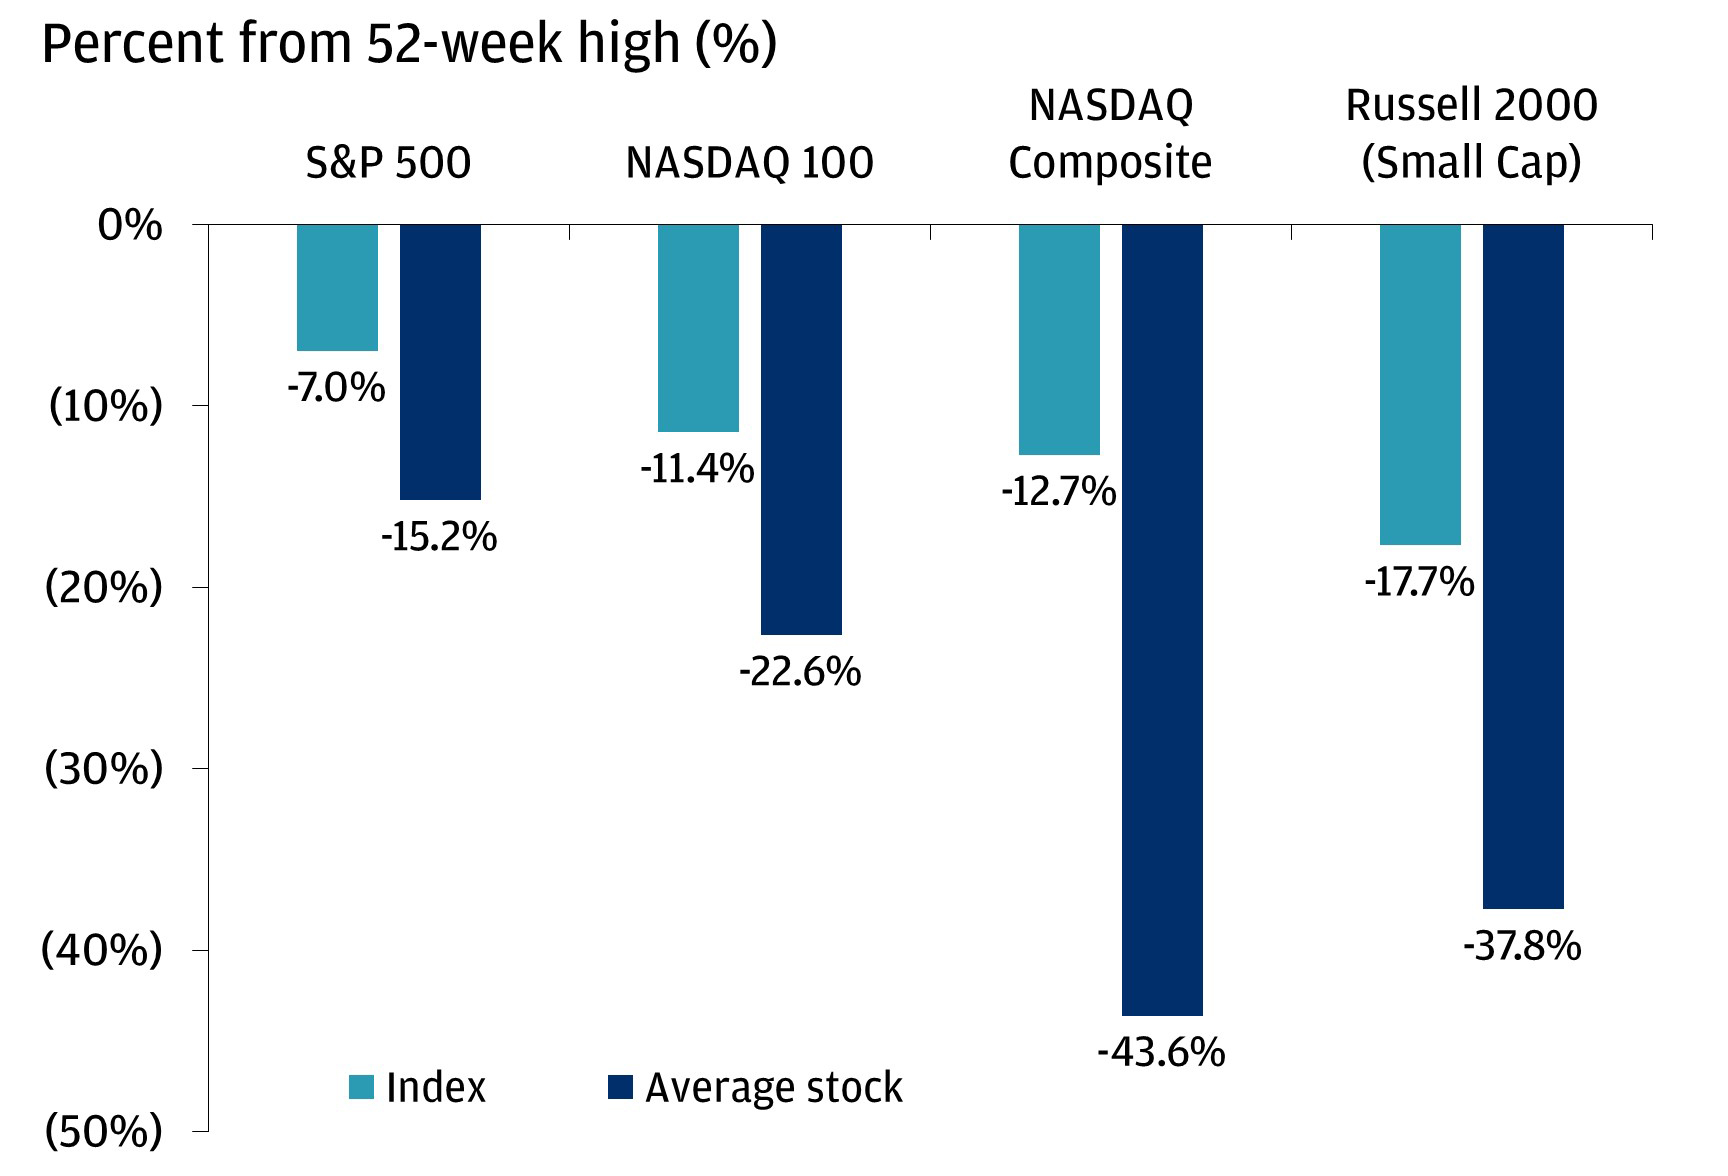
Rough start to the year for markets. The S&P 500 lost another -1.9% so far this week, which means the index is now -7.0% lower than its record set earlier this month. The NASDAQ 100 is in correction territory: -11.4% lower from its last all-time high.


We talked about why the sell-off was happening last week. In short, the prospect of a Fed that is focused on fighting inflation by raising interest rates and reducing the size of its balance sheet is tough for the market to digest.


While the headline indices are under pressure, they have notably held up much better than the average stock inside the index. For example, while the S&P 500 is down 7.0% from its all-time high, the average stock within the index is down over 15%!


It serves as a reminder of a classic investing adage: It’s not a stock market, it’s a market of stocks. Point being: If you don’t look underneath the surface, you can miss a lot about the dynamics that are driving the indices one way or the other. Another key takeaway: Diversification is your friend when volatility is elevated.

REMEMBER, IT’S A “MARKET OF STOCKS”

Bar chart of stocks percent from 52-week high
Source: FactSet. Data as of January 20, 2022
See expandable image , opens new browser window | Show text version, opens overlay

So the stock market has been under pressure. How can you, an investor, manage your way through the rut while sticking to your plan and achieving your financial goals? We like to stick to these three simple rules.

Spotlight: How to navigate a stock market sell-off

Remember that stock market sell-offs are normal. Are you familiar with the concept of risk and return? The saying (and the math) suggest that if you don’t take much risk, you shouldn’t expect much return.


Stocks are inherently risky because when you buy equity in a business, you are providing it with capital that it will hopefully use to expand capacity, develop a disruptive product or make a transformative acquisition that generates solid earnings over the long term that you, an investor, are entitled to.


The risk is that the business may not ever pay you back (e.g., because it goes bankrupt), or may not pay you back as much as you assumed it would (e.g., because its product becomes obsolete).


Investors use stocks in portfolios to generate returns. Sometimes, though, the future earnings of the companies get called into question (e.g., because economic growth may slow), or the marketplace doesn’t think the future expected earnings are worth as much as they may have been a week or month ago (e.g., because interest rates may have risen).


This leads to stock market sell-offs that are larger, and happen with more frequency, than you might think.


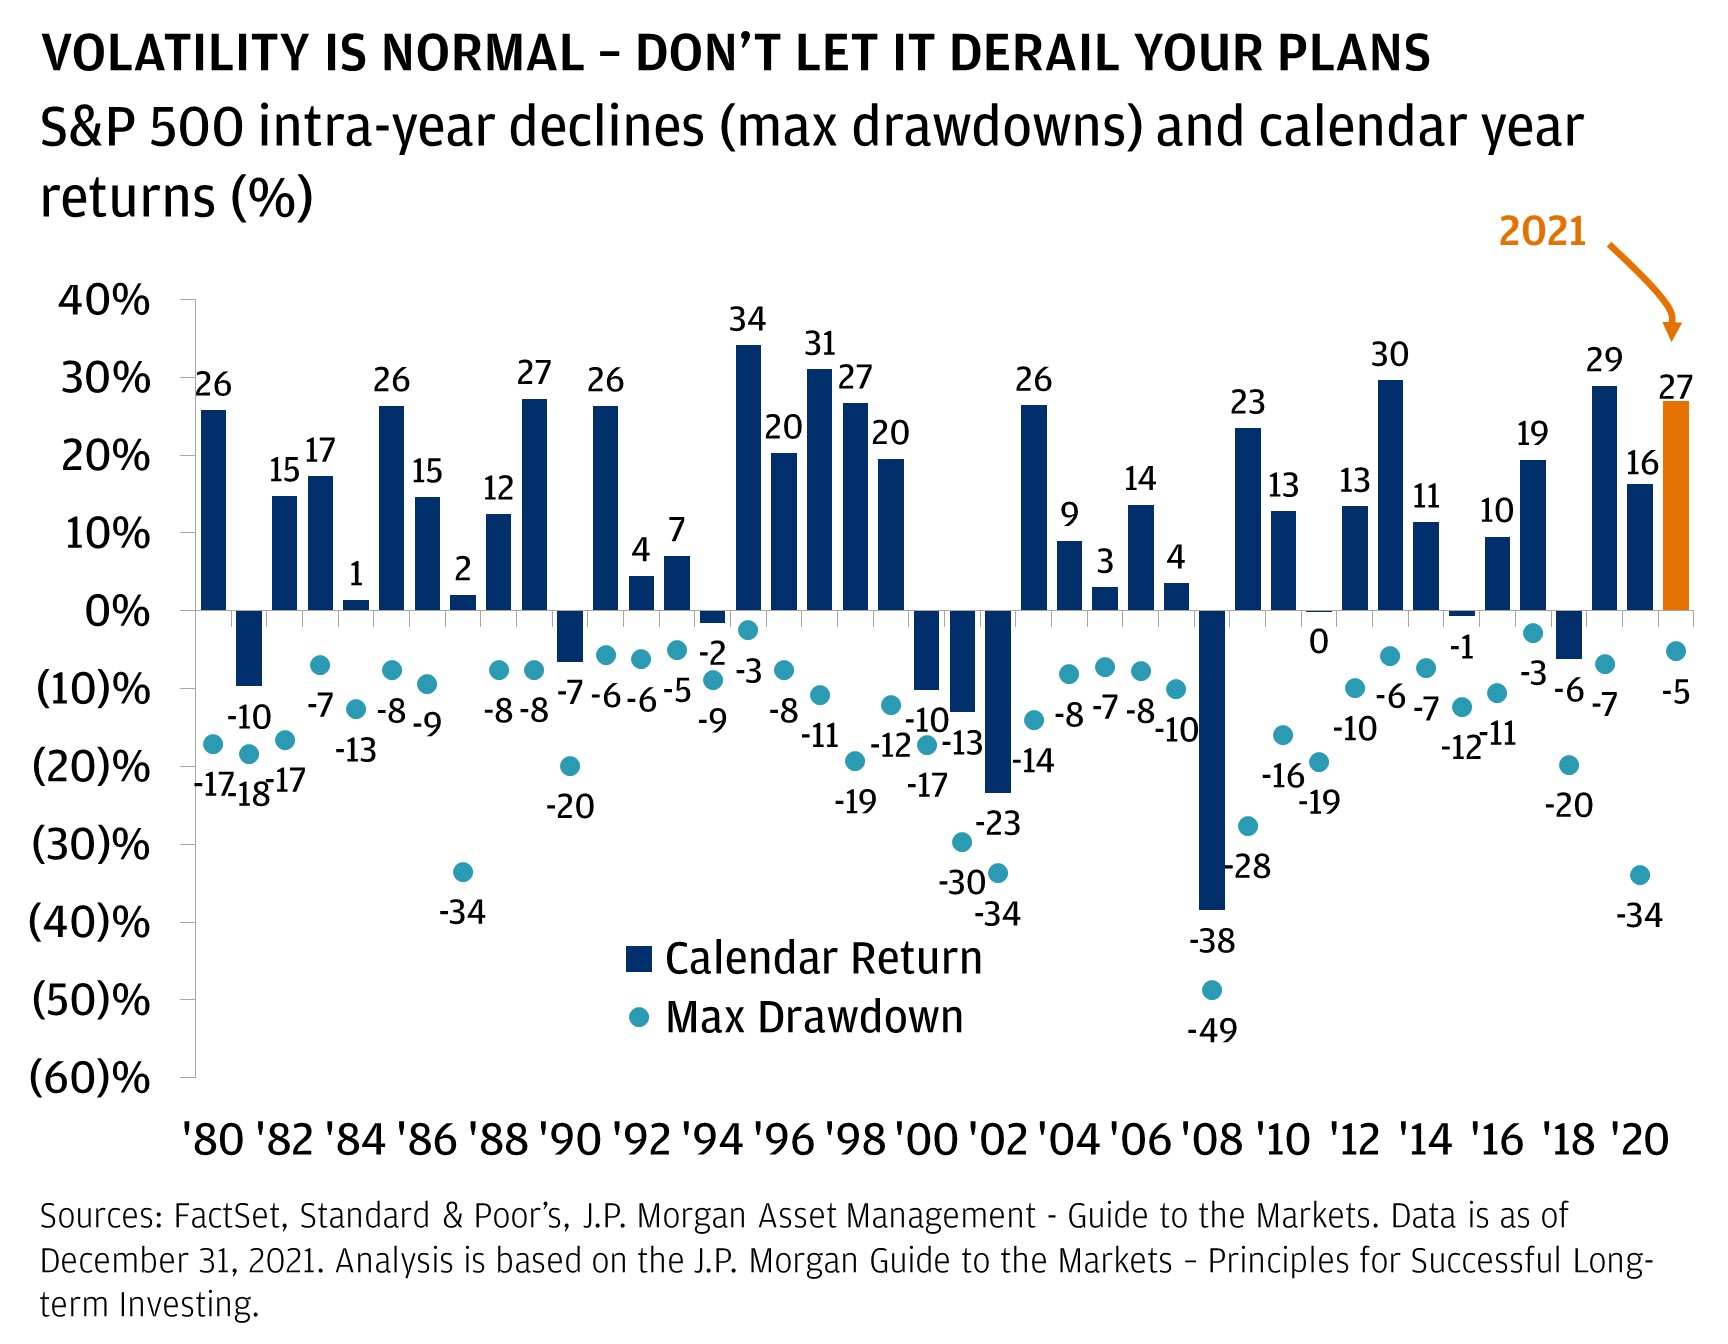
This particular ~5% sell-off in the S&P 500 is the 27th one since March 2009. Looking back at the average calendar year (back to 1980), the S&P 500 has experienced a 14% peak-to-trough decline. Despite these sell-offs, the annual return of the index was positive in 31 out of 41 years. Notably, last year was quite abnormal in that the largest peak-to-trough sell-off was only -5%. This year may end up being much closer to average.

VOLATILITY IS NORMAL – DON’T LET IT DERAIL YOUR PLANS

Sources: FactSet, Standard & Poor’s, J.P. Morgan Asset Management - Guide to the Markets. Data is as of January 20, 2022. Analysis is based on the J.P. Morgan Guide to the Markets – Principles for Successful Long-term Investing.
Bar chart of S&P 500 intra-year declines and calendar year returns
See expandable image , opens new browser window | Show text version, opens overlay

Understand why the sell-off is happening. Understanding why a sell-off is happening can help an investor decide if the turbulence is part of the “normal” course of investing or whether it is a sign of a bigger impending drawdown.


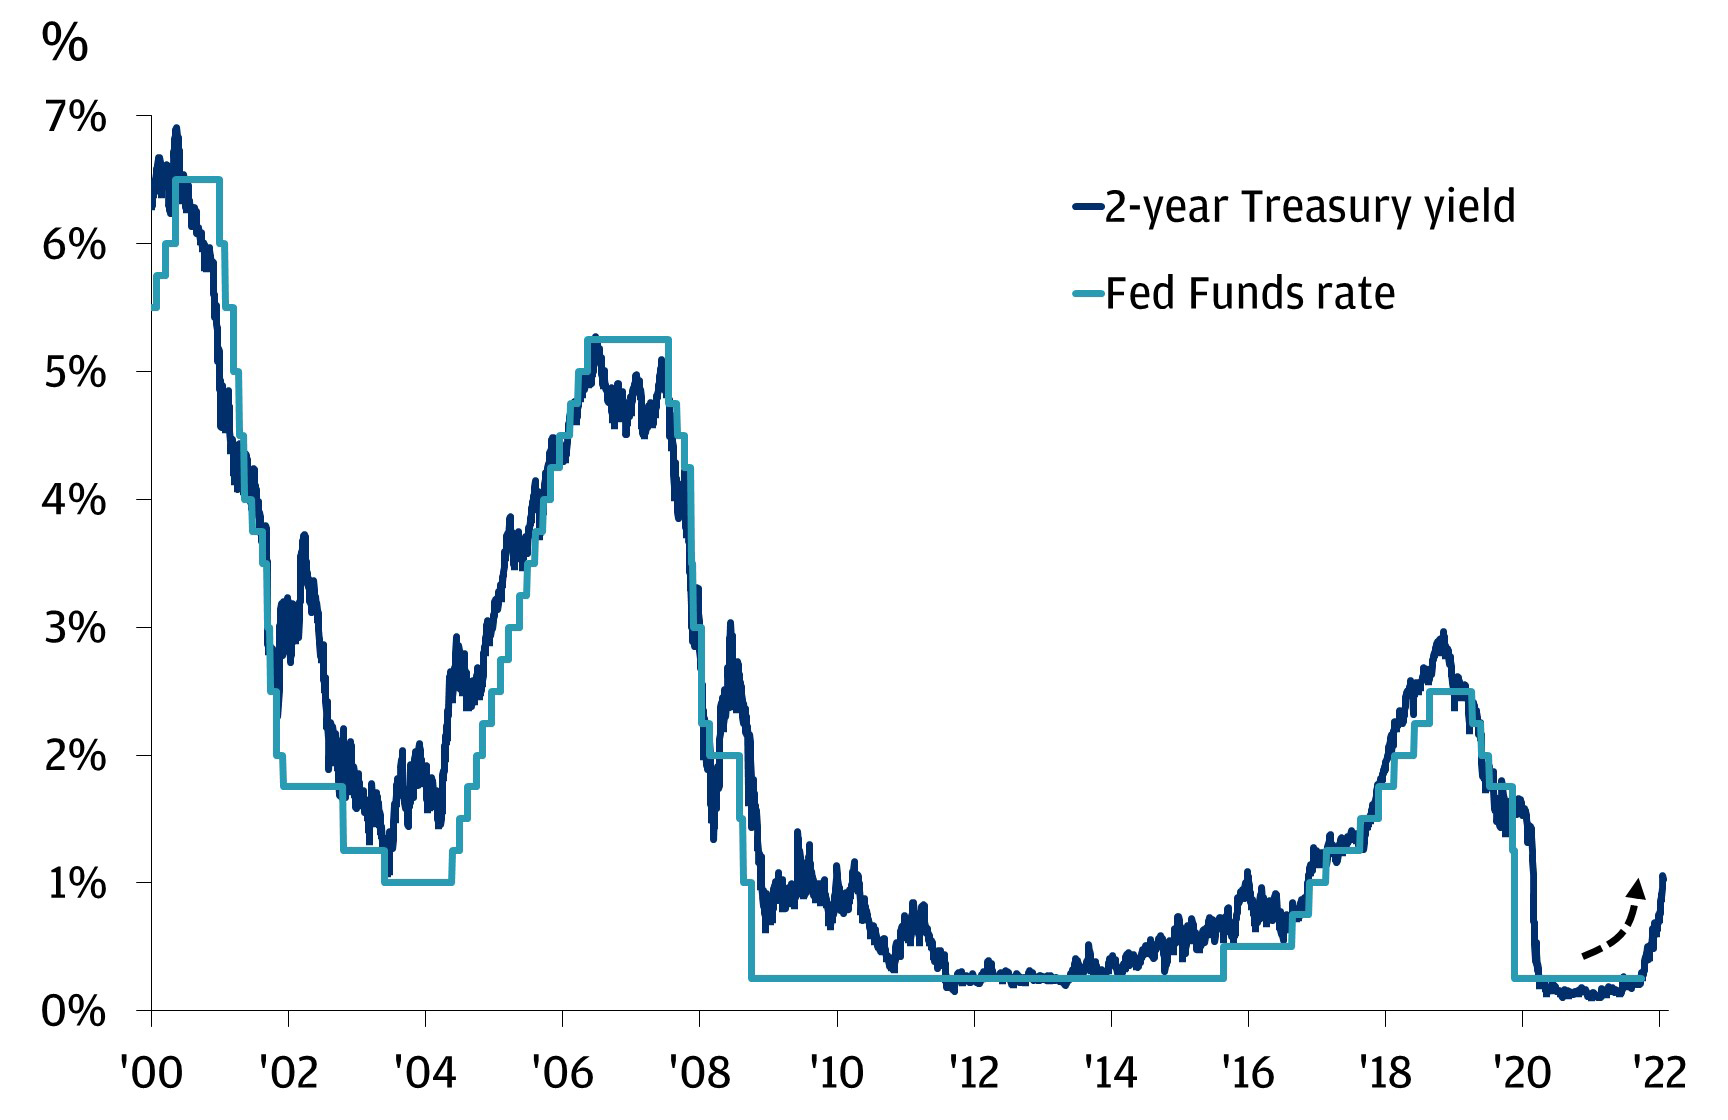
In this particular sell-off, we think a few factors are driving the weakness. The main one, in our eyes, is that the Federal Reserve has taken a much more aggressive stance toward fighting inflation. Investors are now expecting at least four 25 basis point interest rate hikes this year, which has sent interest rates across maturities materially higher than they were at the beginning of the year. 

IMPENDING RATE HIKES AND RISING YIELDS ARE THREATENING THE EQUITY MARKET

Line graph of treasury yield vs. fed funds rate
Source: Bloomberg Finance L.P. Data as of January 20, 2022
See expandable image , opens new browser window | Show text version, opens overlay

Stocks are getting hit by this for two reasons. First, the rate at which investors discount future cash flows is higher, which brings down the current valuation of companies. Second, higher rates usually mean slower economic and earnings growth in the future, which can hurt stock prices now.


As we discussed in detail last week, we don’t think this particular sell-off is the first stage of a material drawdown. Stocks have exhibited some turbulence in the months around “lift-off,” but they tend to find their footing once they adjust to higher policy rates. In the last six hiking cycles, which lasted 18 months on average, the average S&P 500 return was over 13%.


Rates are rising, and fast, but equities tend to rally during rate hiking cycles because they tend to happen when the economy is strong. We don’t see a compelling reason why this time would be different.

Think about your goals, and some potential changes

If you agree that this sell-off is “normal” and not the harbinger of a bear market, the next step is to ask if your financial goals have changed. If so, then it probably makes sense to consider holistic changes to your investment portfolio. If not, then big changes probably aren’t necessary, but tweaks to portfolios could be helpful.


Here are two changes that we have made in portfolios that we think can help in the environment emerging over the next several months.


  • Focus on quality across sectors. The types of companies that have suffered the most during this bout of weakness are ones that don’t have any profits now but could have rapid growth and huge profits in the future. A basket of unprofitable tech/tech adjacent companies is down over 17% so far this year, much worse than the market as a whole. Focusing on profitability should be increasingly valuable as interest rates continue to rise. Further, balancing between characteristics is also important. There is more to the market than just technology. Owning companies that are linked to the real economy (in areas like finance, industrials, and pockets of energy) probably makes sense in a strong growth environment.
  • Check in on fixed income portfolios. It usually doesn’t make sense to invest too heavily in fixed income in a high inflation, rising rate environment. However, now might be the time to start getting familiar with the asset class again. Now that the market has raised its expectations for interest rate hikes, front end yields look more attractive and active managers can pull various levers to help outperform cash. It also probably makes sense to think about methodically closing underweights to core bonds as 10-year treasury yields start to move towards 2%. We aren’t quite there yet, but given the way this year is going, it makes sense to be ready.


To hear more about what we think of this equity market sell-off, and how you can navigate it, please reach out to your JPMorgan Advisor.

Invest your way

Not working with us yet? Find a J.P. Morgan Advisor or explore ways to invest online. 

Continue

All market data from Bloomberg Finance L.P., 1/20/22.

You may also like

Top Market Takeaways

Article Top Market Takeaways Finding opportunity in increasing deficits

A new tax bill is poised to push the U.S. debt burden higher. Here’s what you can do to find opportunity.

By Alan Wynne
Top Market Takeaways

Article Top Market Takeaways How to protect your portfolio

The U.S. economy has faced increased risks to growth and inflation in 2025. Here’s how you can stay protected.

By Carter Griffin

Article Investment strategy Strategic liquidity in an ever-evolving market environment

In an ever-evolving market environment, diverse forms of liquidity are crucial for investors when it comes to staying prepared for the unexpected. Read on to learn more.

By Angelena Mascilli
3 min read

Invest your way

From online investing to working with an advisor, J.P. Morgan is ready to help you achieve your goals.

Continue, to investment offers page.

Disclosures

Our Top Market Takeaways for January 20th, 2022.

All companies referenced are shown for illustrative purposes only, and are not intended as a recommendation or endorsement by J.P. Morgan in this context.

Not all option strategies are suitable for al...

Read more disclosures about this article

Our Top Market Takeaways for January 20th, 2022.

All companies referenced are shown for illustrative purposes only, and are not intended as a recommendation or endorsement by J.P. Morgan in this context.

Not all option strategies are suitable for all investors. Certain strategies may expose investors to significant potential risks and losses. For additional risk information, please read the “Characteristics and Risks of Standardized Options”. We advise investors to consult their tax advisors and legal counsel about the tax implications of these strategies. Investors are urged to carefully consider whether options or option-related products or strategies are suitable for their needs.

All market and economic data as of January 2022 and sourced from Bloomberg and FactSet unless otherwise stated.

We believe the information contained in this material to be reliable but do not warrant its accuracy or completeness. Opinions, estimates, and investment strategies and views expressed in this document constitute our judgment based on current market conditions and are subject to change without notice.

RISK CONSIDERATIONS

  • Past performance is not indicative of future results. You may not invest directly in an index.
  • The prices and rates of return are indicative, as they may vary over time based on market conditions.
  • Additional risk considerations exist for all strategies.
  • The information provided herein is not intended as a recommendation of or an offer or solicitation to purchase or sell any investment product or service.
  • Opinions expressed herein may differ from the opinions expressed by other areas of J.P. Morgan. This material should not be regarded as investment research or a J.P. Morgan investment research report.

The views, opinions, estimates and strategies expressed herein constitutes the author's judgment based on current market conditions and are subject to change without notice, and may differ from those expressed by other areas of J.P. Morgan. This information in no way constitutes J.P. Morgan Research and should not be treated as such. You should carefully consider your needs and objectives before making any decisions. For additional guidance on how this information should be applied to your situation, you should consult your advisor.

In general, the bond market is volatile and bond prices rise when interest rates fall and vice versa. Longer term securities are more prone to price fluctuation than shorter term securities. Any fixed income security sold or redeemed prior to maturity may be subject to substantial gain or loss. Dependable income is subject to the credit risk of the issuer of the bond. If an issuer defaults no future income payments will be made.

The price of equity securities may rise or fall due to the changes in the broad market or changes in a company's financial condition, sometimes rapidly or unpredictably. Equity securities are subject to 'stock market risk' meaning that stock prices in general may decline over short or extended periods of time.

International investments may not be suitable for all investors. International investing involves a greater degree of risk and increased volatility. Changes in currency exchange rates and differences in accounting and taxation policies outside the U.S. can raise or lower returns. Some overseas markets may not be as politically and economically stable as the United States and other nations. Investments in international markets can be more volatile.

Show Less