Start of the overlay
Image description

S&P 500 average annual price returns, 1928-2023, percentage


The chart shows the S&P 500 average annual price returns from 1926-2023 in election years versus non-election years.


In an election year the average return is 7.5% while the non-election year average is 8.0%.

End of the overlay
Start of the overlay
Image description

S&P 500 moves around U.S. elections since 1984, Indexed to Election Day


This chart shows the S&P 500 performance around U.S. elections since 1980, Indexed to Election Day.


At 18 months prior to election day the price index in 1984 was 99, in 1992 was 91, in 1996 was 74, in 2004 was 82, in 2012 was 80 and the average of the price index across all elections since 1984 at 18 months prior was 97.


At 6 months prior to election day the price index in 1984 was 95, in 1992 was 99, in 1996 was 91, in 2004 was 98, in 2012 was 93 and the average of the price index across all elections since 1984 at 6 months prior was 100.


At 3 months prior to election day the price index in 1984 was 97, in 1992 was 101, in 1996 was 94,in was 2004 97, in 2012 was 95 and the average of the price index across all elections since 1984 at 3 months prior was 102.


At 6 months after election day the price index in 1984 was 108, in 1992 was 105, in 1996 was 116, in 2004 was 102, in 2012 was 104 and the average of the price index across all elections since 1984 at 6 months after was 106.


At 12 months after election day the price index in 1984 was 114, in 1992 was 112, in 1996 was 130, in 2004 was 106, in 2012 was 103 and the average of the price index across all elections since 1984 at 12 months prior was 113.


In 2008 the price index was 111, in 2016 was 122, in 2020 was 139 and the average was 113.

End of the overlay
Start of the overlay
Image description

Change in Fed funds rate during election years, percentage


This chart shows the change in Fed Funds rate during election years.


As of December 2020, the one year change to the closest 12.5bps in the Fed funds rate was -1.5%.


As of December 2016, the one year change to the closest 12.5bps in the Fed funds rate was 0.25%.


As of December 2012, the one year change to the closest 12.5bps in the Fed funds rate was 0%.


As of December 2008, the one year change to the closest 12.5bps in the Fed funds rate was -4%.


As of December 2004, the one year change to the closest 12.5bps in the Fed funds rate was 1.25%.


As of December 2000, the one year change to the closest 12.5bps in the Fed funds rate was 1%.


As of December 1996, the one year change to the closest 12.5bps in the Fed funds rate was -0.25%.


As of December 1992, the one year change to the closest 12.5bps in the Fed funds rate was -1%.


As of December 1988, the one year change to the closest 12.5bps in the Fed funds rate was 1.88%.


As of December 1984, the one year change to the closest 12.5bps in the Fed funds rate was -1.25%.


As of December 1980, the one year change to the closest 12.5bps in the Fed funds rate was 4%.


As of December 1976, the one year change to the closest 12.5bps in the Fed funds rate was 1%.


As of December 1972, the one year change to the closest 12.5bps in the Fed funds rate was 2%.


As of December 1968, the one year change to the closest 12.5bps in the Fed funds rate was 1.5%.


As of December 1964, the one year change to the closest 12.5bps in the Fed funds rate was 0.5%.


As of December 1960, the one year change to the closest 12.5bps in the Fed funds rate was -2.5%.


As of December 1956, the one year change to the closest 12.5bps in the Fed funds rate was 0.5%. 

End of the overlay

Top Market Takeaways 3 election year myths debunked

Updated Jan 19, 2024
Play Video: CWM - Top Market Takeaways 01.19.24
Transcript Audio description ON Audio description OFF

As if it wasn’t busy enough, 2024 is the year of elections.


Over 40% of the world’s population and economy will hit the polls to elect national leaders, starting with Taiwan last weekend and culminating with the United States in November. This past week’s Iowa caucus already kicked off U.S. primary season, and New Hampshire follows next week. Election debate will only ramp up from here.


Right now, it’s looking like another Biden versus Trump standoff – at least according to prediction markets, favorability polls and most political pundits. That said, 10 months is a long time in politics. Much could change, and the lead-up to Election Day can stir up emotions and apprehension about the future.


Today, we debunk three common election myths when it comes to markets.


Myth 1: Stocks don’t do well in election years


Reality: Returns in election and non-election years usually aren’t all that different.


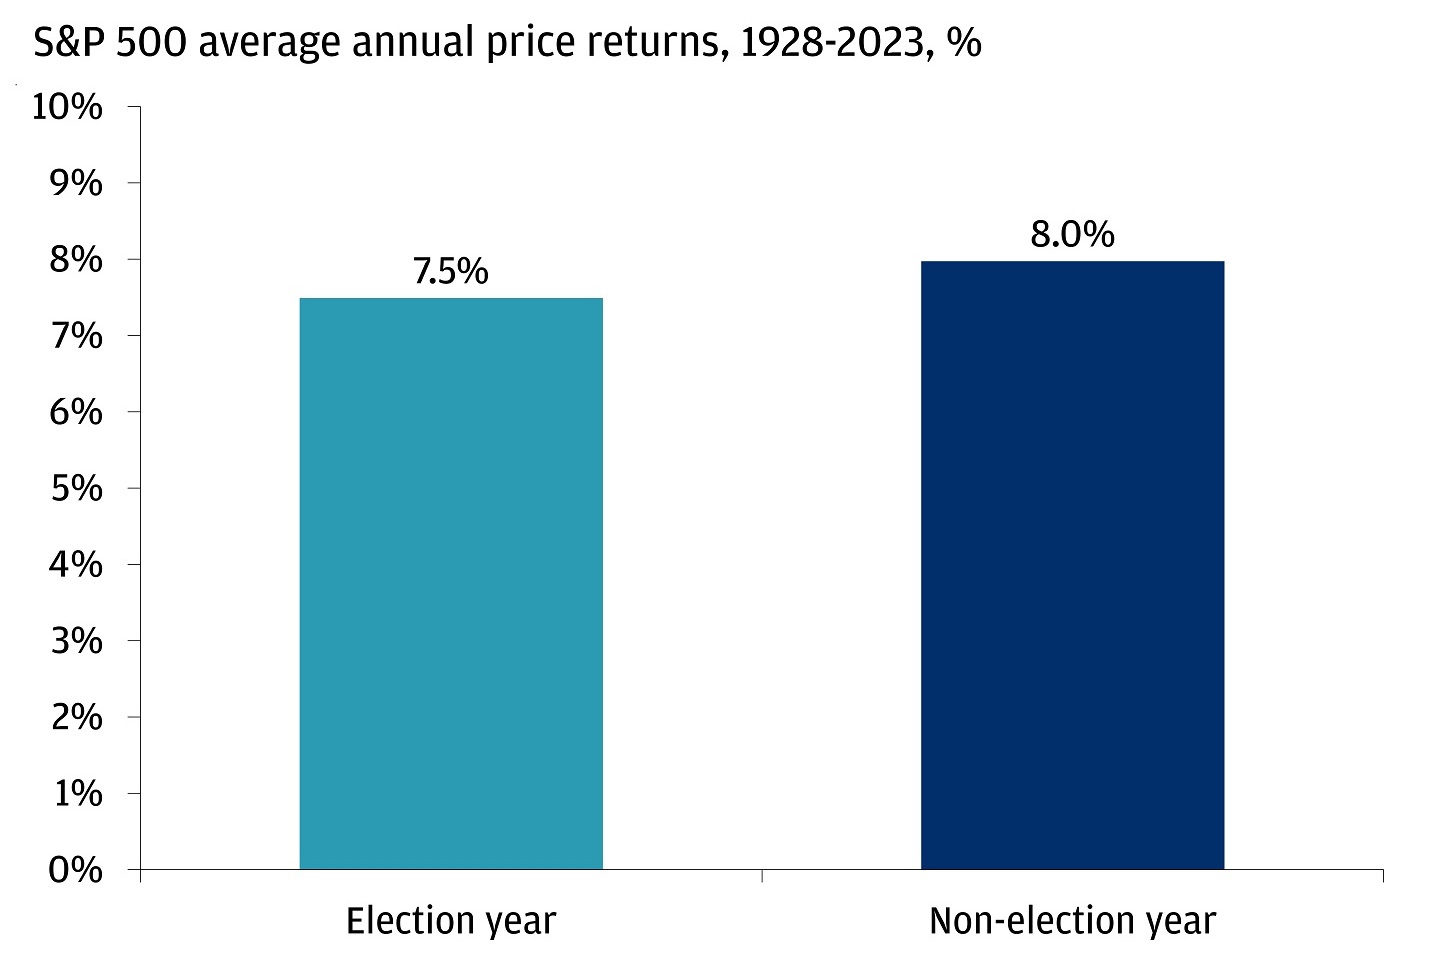
We took a look at how the S&P 500 has fared in both instances. Going back to 1928 (for as long as we have data), stocks returned 7.5% on average during election years, compared with 8% during non-election years. Slightly weaker but still solid.

Stock returns don’t tend to differ much in election years

The bar graph shows the S&P 500 average annual price returns from 1926-2023 in election years versus non-election years.
Source: Bloomberg Finance L.P. Data as of December 31, 2023. Past performance is no guarantee of future results. It is not possible to invest directly in an index.
See expandable image , opens new browser window | Show text version, opens overlay

That said, election years do tend to be more volatile than most, especially in the lead-up to voting day. For instance, the average election year since 1980 has seen an intra-year drawdown of about 17% versus 13% in non-election years. Volatility is a feature, not a bug, of investing in any year, but it tends to be more pronounced as households grapple with more uncertainty.


Yet as that uncertainty dissipates as results are announced, stocks tend to rally on a sense of clarity about the path forward.


Myth 2: Markets will crash if so and so candidate wins


Reality: We’ve seen booms and busts on both sides of the aisle. The economic backdrop tends to matter more.


While stocks tend to rally in elections’ aftermaths, it’s true that some election years have seen bigger swings than others. But those instances have tended to do more with the underlying macroeconomic backdrop than the election itself.


For instance, in the last presidential election in 2020, it was the tides of lockdown and reopening from the COVID-19 pandemic that impacted broad markets most, rather than the differing ideologies between now-President Biden and then-President Trump. Or consider 2008 when Democrat Barack Obama ran against Republican John McCain: The unfolding Global Financial Crisis was the predominant driver, rather than opposing candidate views on the war in Iraq and health care policy.


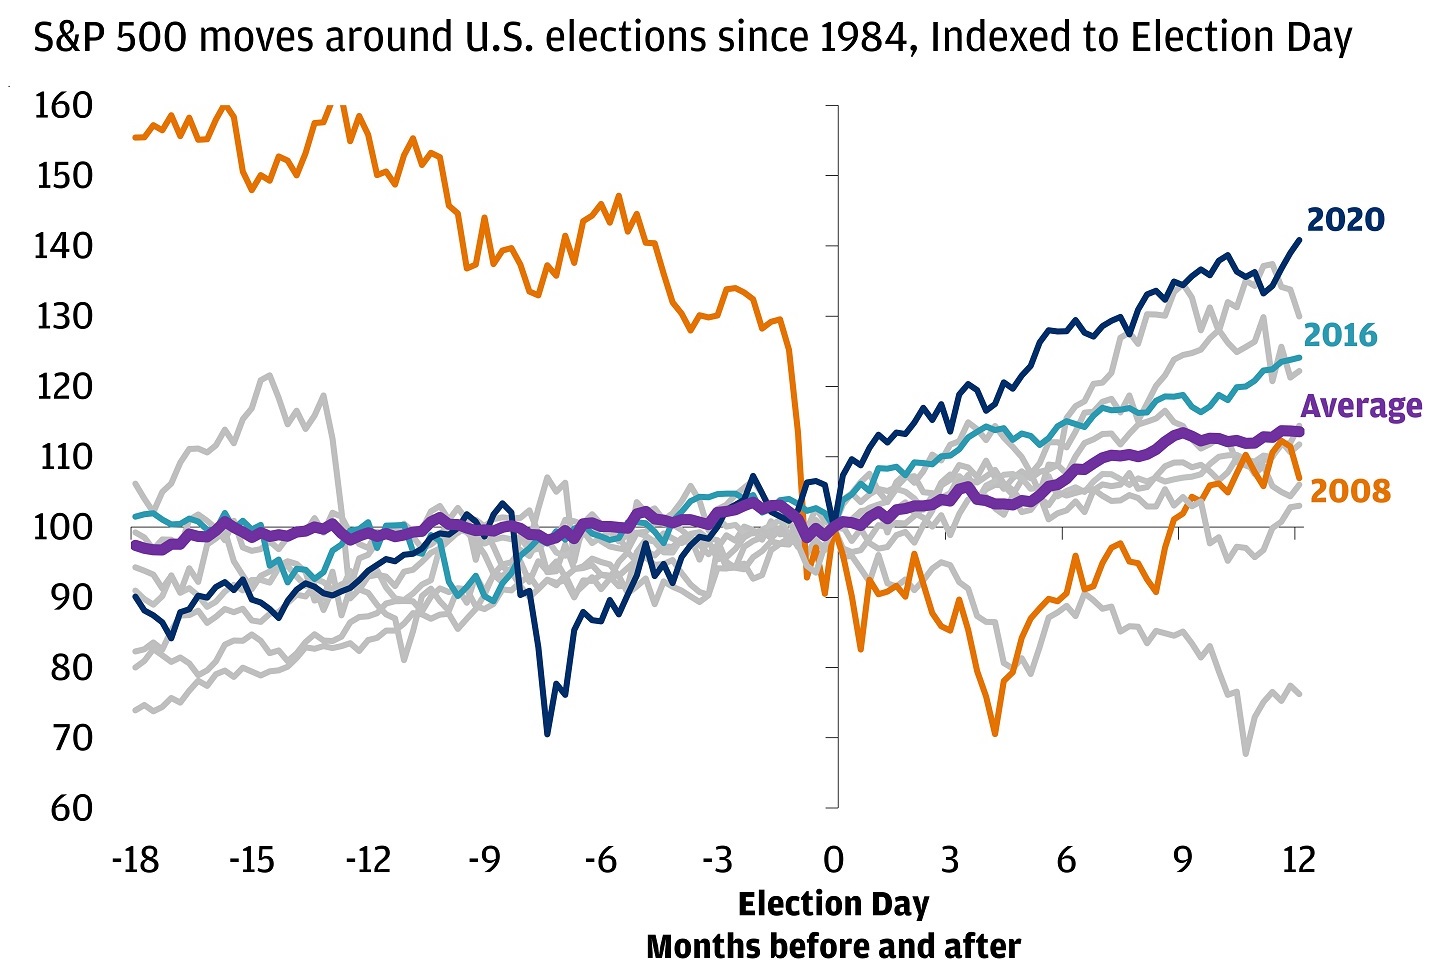
With that, and the last 40 years of elections in hand, stocks have still been higher a year later on average.

Election jitters? Markets tend to rally as uncertainty fades

The line graph shows the S&P 500 performance around U.S. elections since 1980, Indexed to Election Day.
Source: Bloomberg Finance L.P. Analysis as of January 18, 2024. Past performance is no guarantee of future results. It is not possible to invest directly in an index.
See expandable image , opens new browser window | Show text version, opens overlay

Myth 3: The Federal Reserve doesn’t change policy in election years


Reality: The Fed hasn’t shied away from hiking or cutting rates during election years.


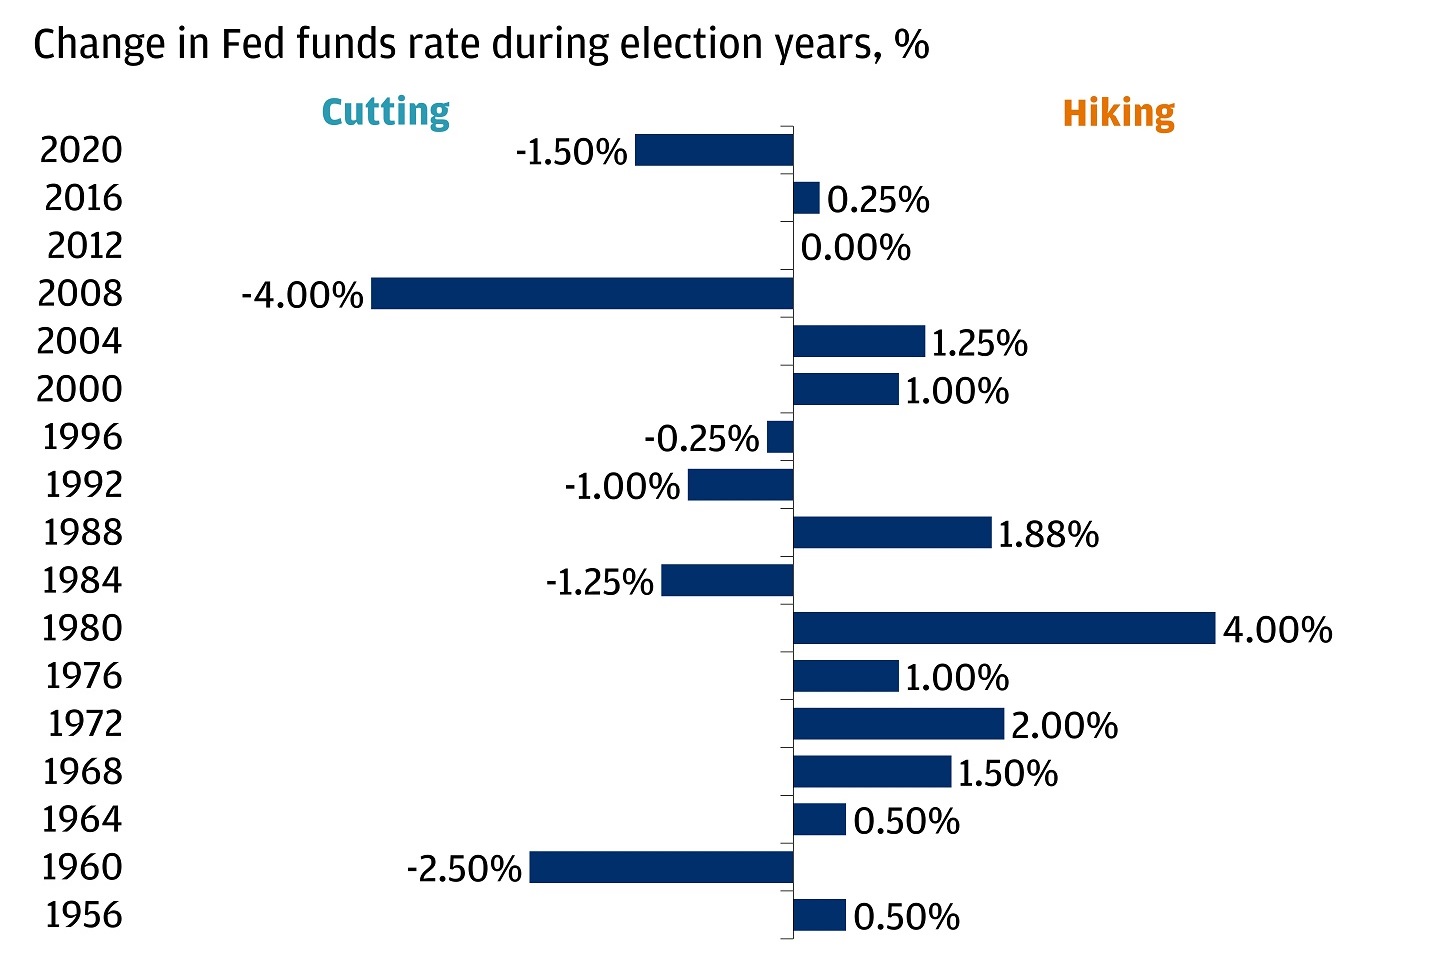
Going back to the 1950s, 2012 has been the only election year that the Fed did not either raise or lower interest rates. Similar to myth #2, this suggests that the economy, rather than politics, is in the driver’s seat when it comes to monetary policy. We believe that this year will be no different.


The Fed has still made moves in election years

This bar graph shows the change in Fed Funds rate during election years
Sources: Federal Reserve, St. Louis Fed, Haver Analytics. Data uses the effective Fed funds rate from St. Louis Fed for 1954-1968 and the Fed target policy range from 1972-2020. Analysis is as of January 18, 2023. Data rounded to nearest 12.5bps.
See expandable image , opens new browser window | Show text version, opens overlay

The Fed’s big focus today is how to softly land the economy, and it’s no small task. The pivot toward rate cuts requires careful navigation, ensuring inflation makes the last mile of progress and that growth doesn’t tip into recession.


That said, once the election results are in, the new administration’s policy proposals could shift expectations for growth, inflation and even earnings. Some could also impact individual sectors that are most closely linked. But at this point in the race, it’s still too early to outline those potential impacts, and it’s also important to note that not all policy proposals go through. High-impact proposals seem more likely to be adopted only if one party controls the White House and Congress, and even then, policymakers are often confronted with challenges and bottlenecks.


As the election chatter builds, we expect some of the hot button issues to include government spending and the deficit, tax policy, regulation, trade and geopolitics.


How can you plan for the year ahead?


While politics can evoke strong emotions, we don’t think one should lose sight of their long-term investment goals. We believe the economy will remain the predominant driver of policy decisions and markets broadly.


Of course, there are risks, from ongoing friction points such as inflation to wildcards such as geopolitics. But we believe that as growth holds up, price pressures abate, and the Fed embarks on an easing path, there is ample opportunity for multi-asset investors in the year ahead.


Your J.P. Morgan team is here to help you navigate the shifting landscape and create a portfolio that is built to last, whether it be through business cycles or elections.

All market and economic data as of 01/19/2024 are sourced from Bloomberg Finance L.P. and FactSet unless otherwise stated.

Invest your way

Not working with us yet? Find a J.P. Morgan Advisor or explore ways to invest online. 

Continue

You may also like

Top Market Takeaways

Article Top Market Takeaways Q1 2025 earnings season insights

Over 90% of S&P 500 companies have reported their Q1 2025 earnings results. What have we learned from them?

By Global Investment Strategy Team
Top Market Takeaways

Article Top Market Takeaways April US CPI: Inflation softer than expected

April's Consumer Price Index (CPI) release revealed an inflation rate that was lower than expected.

By Global Investment Strategy Team

Article Economic outlook April 2025 inflation rate lower than expected: What this means for investors

The April 2025 Consumer Price Index (CPI) print from the Bureau of Labor Statistics showed that inflation cooled further in April. However, the potential impact of tariffs still looms.

By Seth Carlson
4 min read

Invest your way

From online investing to working with an advisor, J.P. Morgan is ready to help you achieve your goals.

Continue, to investment offers page.

Disclosures

Our Top Market Takeaways for January 19, 2024.


Index definitions:


The information presented is not intended to be making value judgments on the preferred outcome of any government decision or political election.


The S&P 50...

Read more disclosures about this article

Our Top Market Takeaways for January 19, 2024.


Index definitions:


The information presented is not intended to be making value judgments on the preferred outcome of any government decision or political election.


The S&P 500® is widely regarded as the best single gauge of large-cap U.S. equities and serves as the foundation for a wide range of investment products. The index includes 500 leading companies and captures approximately 80% coverage of available market capitalization.


Standard and Poor’s 500 Index is a capitalization-weighted index of 500 stocks. The index is designed to measure performance of the broad domestic economy through changes in the aggregate market value of 500 stocks representing all major industries. The index was developed with a base level of 10 for the 1941–43 base period.


The Bloomberg Eco Surprise Index shows the degree to which economic analysts under- or over-estimate the trends in the business cycle. The surprise element is defined as the percentage difference between analyst forecasts and the published value of economic data releases.


The MSCI World Index is a free float-adjusted market capitalization index that is designed to measure global developed market equity performance. " between the Bloomberg Eco Surprise Index and Nasdaq 100 Index disclosures?


The NASDAQ 100 Index is a basket of the 100 largest, most actively traded U.S companies listed on the NASDAQ stock exchange. The index includes companies from various industries except for the financial industry, like commercial and investment banks. These non-financial sectors include retail, biotechnology, industrial, technology, health care, and others.


The Russell 2000 Index measures small company stock market performance. The index does not include fees or expenses.


We believe the information contained in this material to be reliable but do not warrant its accuracy or completeness. Opinions, estimates, and investment strategies and views expressed in this document constitute our judgment based on current market conditions and are subject to change without notice.


The views, opinions, estimates and strategies expressed herein constitutes the author's judgment based on current market conditions and are subject to change without notice, and may differ from those expressed by other areas of J.P. Morgan. This information in no way constitutes J.P. Morgan Research and should not be treated as such. You should carefully consider your needs and objectives before making any decisions. For additional guidance on how this information should be applied to your situation, you should consult your advisor.

All companies referenced are shown for illustrative purposes only, and are not intended as a recommendation or endorsement by J.P. Morgan in this context.


JPMorgan Chase & Co., its affiliates, and employees do not provide tax, legal or accounting advice. Information presented on these webpages is not intended to provide, and should not be relied on for tax, legal and accounting advice.  You should consult your own tax, legal and accounting advisors before engaging in any financial transaction.


Risk considerations:


  • International investments may not be suitable for all investors. International investing involves a greater degree of risk and increased volatility. Changes in currency exchange rates and differences in accounting and taxation policies outside the U.S. can raise or lower returns. Some overseas markets may not be as politically and economically stable as the United States and other nations. Investments in international markets can be more volatile.
  • Investments in emerging markets may not be suitable for all investors. Emerging markets involve a greater degree of risk and increased volatility. Changes in currency exchange rates and differences in accounting and taxation policies outside the U.S. can raise or lower returns. Some overseas markets may not be as politically and economically stable as the United States and other nations. Investments in emerging markets can be more volatile.
  • Investments in commodities may have greater volatility than investments in traditional securities, particularly if the instruments involve leverage. The value of commodity-linked derivative instruments may be affected by changes in overall market movements, commodity index volatility, changes in interest rates, or factors affecting a particular industry or commodity, such as drought, floods, weather, livestock disease, embargoes, tariffs and international economic, political and regulatory developments. Use of leveraged commodity-linked derivatives creates an opportunity for increased return but, at the same time, creates the possibility for greater loss.
  • Real Estate Investments Trusts may be subject to a high degree of market risk because of concentration in a specific industry, sector or geographical sector. Real estate investments may be subject to risks including, but not limited to, declines in the value of real estate, risks related to general and economic conditions, changes in the value of the underlying property owned by the trust and defaults by borrower.
  • Investment in alternative strategies is speculative, often involves a greater degree of risk than traditional investments including limited liquidity and limited transparency, among other factors and should only be considered by sophisticated investors with the financial capability to accept the loss of all or part of the assets devoted to such strategies.
  • Structured products involve derivatives and risks that may not be suitable for all investors. The most common risks include, but are not limited to, risk of adverse or unanticipated market developments, issuer credit quality risk, risk of lack of uniform standard pricing, risk of adverse events involving any underlying reference obligations, risk of high volatility, risk of illiquidity/little to no secondary market, and conflicts of interest. Before investing in a structured product, investors should review the accompanying offering document, prospectus or prospectus supplement to understand the actual terms and key risks associated with the each individual structured product. Any payments on a structured product are subject to the credit risk of the issuer and/or guarantor. Investors may lose their entire investment, i.e., incur an unlimited loss. The risks listed above are not complete. For a more comprehensive list of the risks involved with this particular product, please speak to your J.P. Morgan team.
  • As a reminder, hedge funds (or funds of hedge funds) often engage in leveraging and other speculative investment practices that may increase the risk of investment loss. These investments can be highly illiquid, and are not required to provide periodic pricing or valuation information to investors, and may involve complex tax structures and delays in distributing important tax information. These investments are not subject to the same regulatory requirements as mutual funds; and often charge high fees. Further, any number of conflicts of interest may exist in the context of the management and/or operation of any such fund. For complete information, please refer to the applicable offering memorandum.
  • For informational purposes only -- J.P. Morgan Securities LLC does not endorse, advise on, transmit, sell or transact in any type of virtual currency. PLEASE NOTE: JPMorgan Securities LLC does not intermediate, mine, transmit, custody, store, sell, exchange, control, administer, or issue any type of virtual currency, which includes any type of digital unit used as a medium of exchange or a form of digitally stored value.
  • The prices and rates of return are indicative, as they may vary over time based on market conditions.
  • Additional risk considerations exist for all strategies.
  • The information provided herein is not intended as a recommendation of or an offer or solicitation to purchase or sell any investment product or service.
  • Opinions expressed herein may differ from the opinions expressed by other areas of J.P. Morgan. This material should not be regarded as investment research or a J.P. Morgan investment research report.
Show Less