Start of the overlay
Image description

Average total return since 1990


This bar chart compares the average total returns for the S&P 500 and MSCI World indices during the periods of May through October and November through April, using data since 1990. The S&P 500 has averaged a total return of 3.26% in the May through October months, compared to 8.31% in the November through April months. The MSCI World has averaged a total return of 1.9% in the May through October months, compared to 7.47% in the November through April months.

End of the overlay
Start of the overlay
Image description

This table looks at annual data going back to 2010 to compare the S&P 500’s full-year total returns to what an investor’s total returns may have been if they divested from the S&P 500 from May through October.


  • 2010: The S&P 500’s full-year total return was 15.1% compared to 14.2% without May through October, meaning that staying invested outperformed by 0.8%.
  • 2011: The S&P 500’s full-year total return was 2.1% compared to 9.9% without May through October, meaning that staying invested underperformed by -7.8% - the only year in which divesting left an investor better off.
  • 2012: The S&P 500’s full-year total return was 16.0% compared to 13.6% without May through October, meaning that staying invested outperformed by 2.4%.
  • 2013: The S&P 500’s full-year total return was 32.4% compared to 19.1% without May through October, meaning that staying invested outperformed by 13.3%.
  • 2014: The S&P 500’s full-year total return was 13.7% compared to 5.1% without May through October, meaning that staying invested outperformed by 8.6%.
  • 2015: The S&P 500’s full-year total return was 1.4% compared to 0.6% without May through October, meaning that staying invested outperformed by 0.8%.
  • 2016: The S&P 500’s full-year total return was 12.0% compared to 7.6% without May through October, meaning that staying invested outperformed by 4.4%.
  • 2017: The S&P 500’s full-year total return was 21.8% compared to 11.7% without May through October, meaning that staying invested outperformed by 10.2%.
  • 2018: The S&P 500’s full-year total return was -4.4% compared to -7.5% without May through October, meaning that staying invested outperformed by 3.1%.
  • 2019: The S&P 500’s full-year total return was 31.5% compared to 26.2% without May through October, meaning that staying invested outperformed by 5.2%.
  • 2020: The S&P 500’s full-year total return was 18.4% compared to 4.5% without May through October, meaning that staying invested outperformed by 13.9%.
End of the overlay

Investment strategy Why you shouldn’t “sell in May and go away” this year

Elana Duré

Editorial staff, J.P. Morgan Wealth Management

Published May 26, 2021 |
2 min read
  • The saying “sell in May and go away” refers to liquidating all positions while you vacation in the summer and is based on the historical underperformance of some stocks in the summer months.
  • Despite the saying, this year may be different than most, as the economy is poised to reopen and recover.
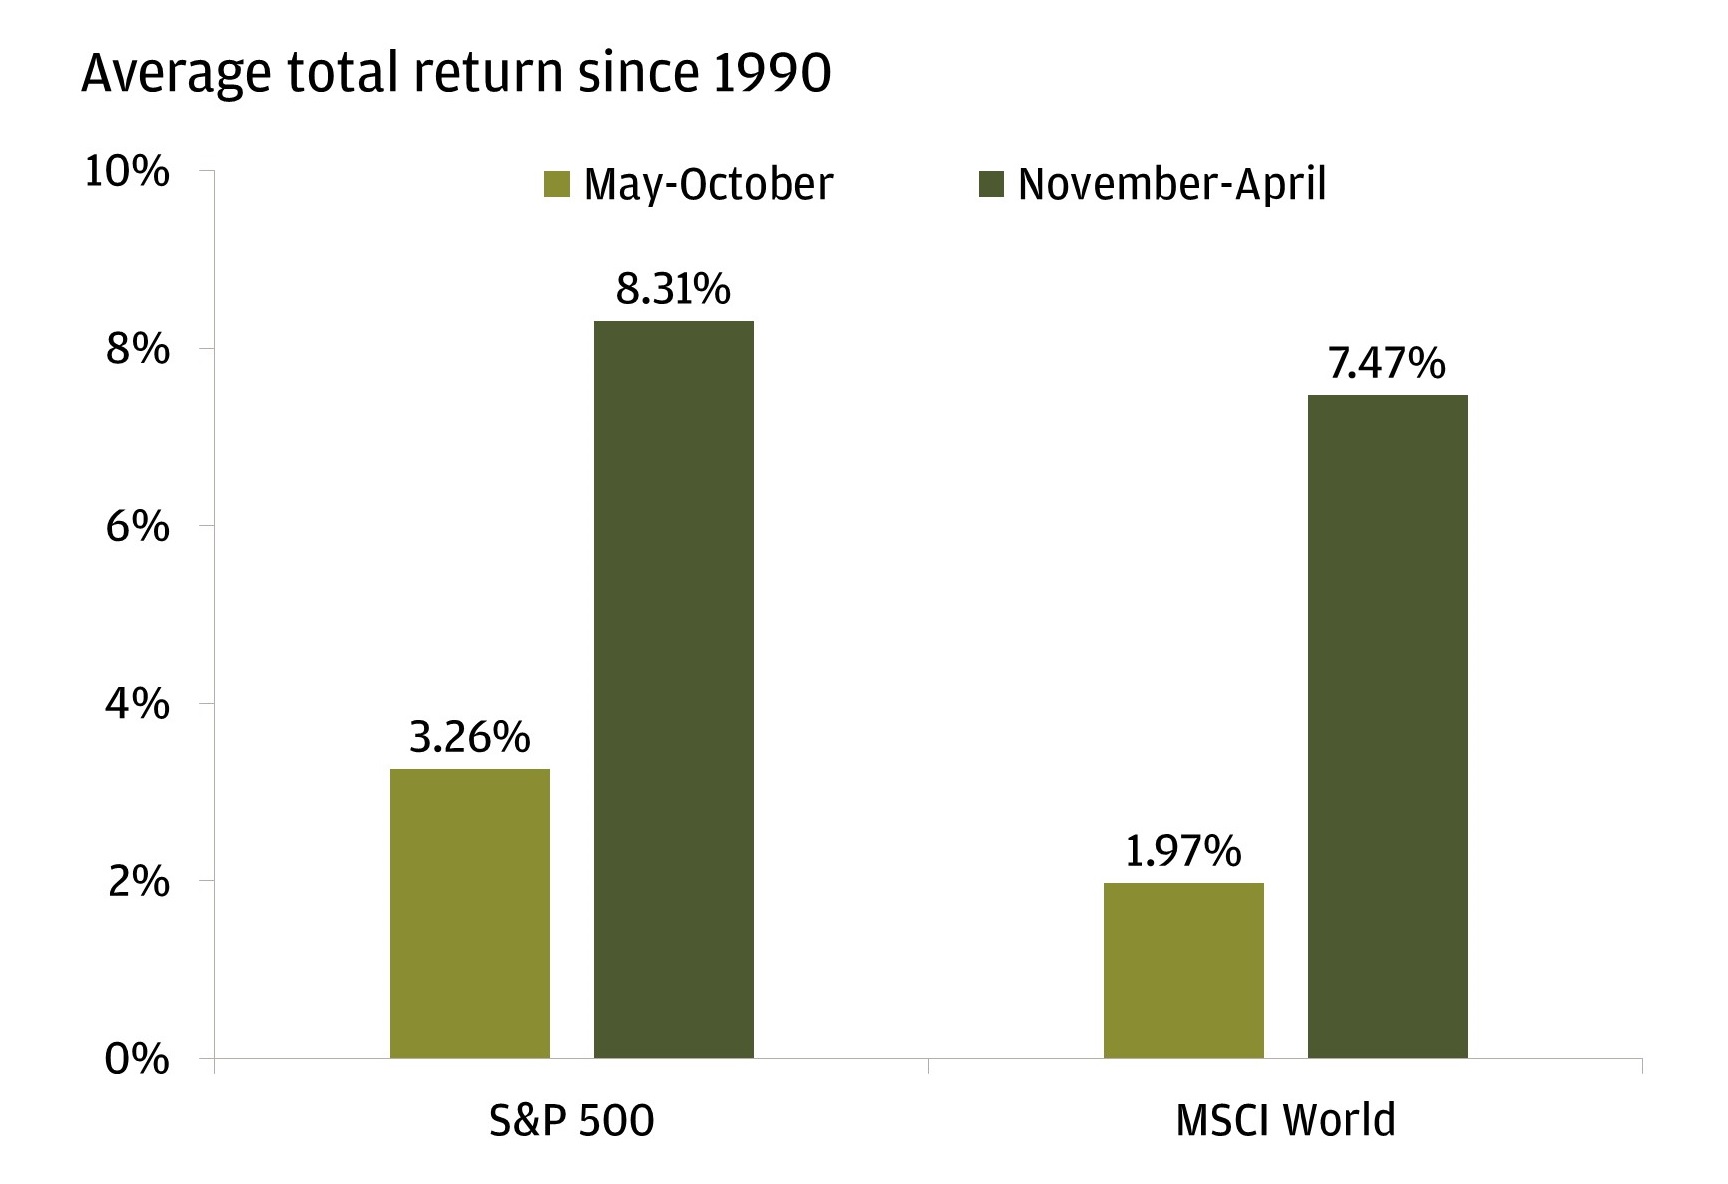
  • Even though historical stock market returns tend to be stronger from November through April, the difference isn’t as much as you may think.

If you were thinking of following the old market adage “Sell in May and go away,” you might want to reconsider.


The saying, which hints toward liquidating all positions while you vacation in the summer, is based on the historical underperformance of some stocks in the six-month period between May and October, compared to the winter months between November and April. Those who follow the strategy believe that low volumes and the lack of market participants in the summer could create a riskier – or uneventful – market period.

Average returns are better from November through April versus May through October

Bar chart of Average total return since 1990
Sources: FactSet, J.P. Morgan Private Bank. Data is as of April 30, 2021.
See expandable image , opens new browser window | Show text version, opens overlay

However, the summer months of 2021 should be anything but lacklustre. The historically weak seasonal stock market performance may be overruled by the gains driven by the economic reopening, prompted by federal stimulus, the Federal Reserve’s easy money policy, rising vaccination rates, falling COVID-19 cases, and rising Treasury yields.


Shawn Quigg, an executive director at JPMorgan Chase, said the reflation and reopening trade could continue into late spring and summer, catalyzing a rotation from growth, quality, and defensive stocks into value and cyclical stocks.


Moreover, analysts expect companies to report strong second quarter earnings results starting in July, which is set to push stock prices even higher during the summer months.


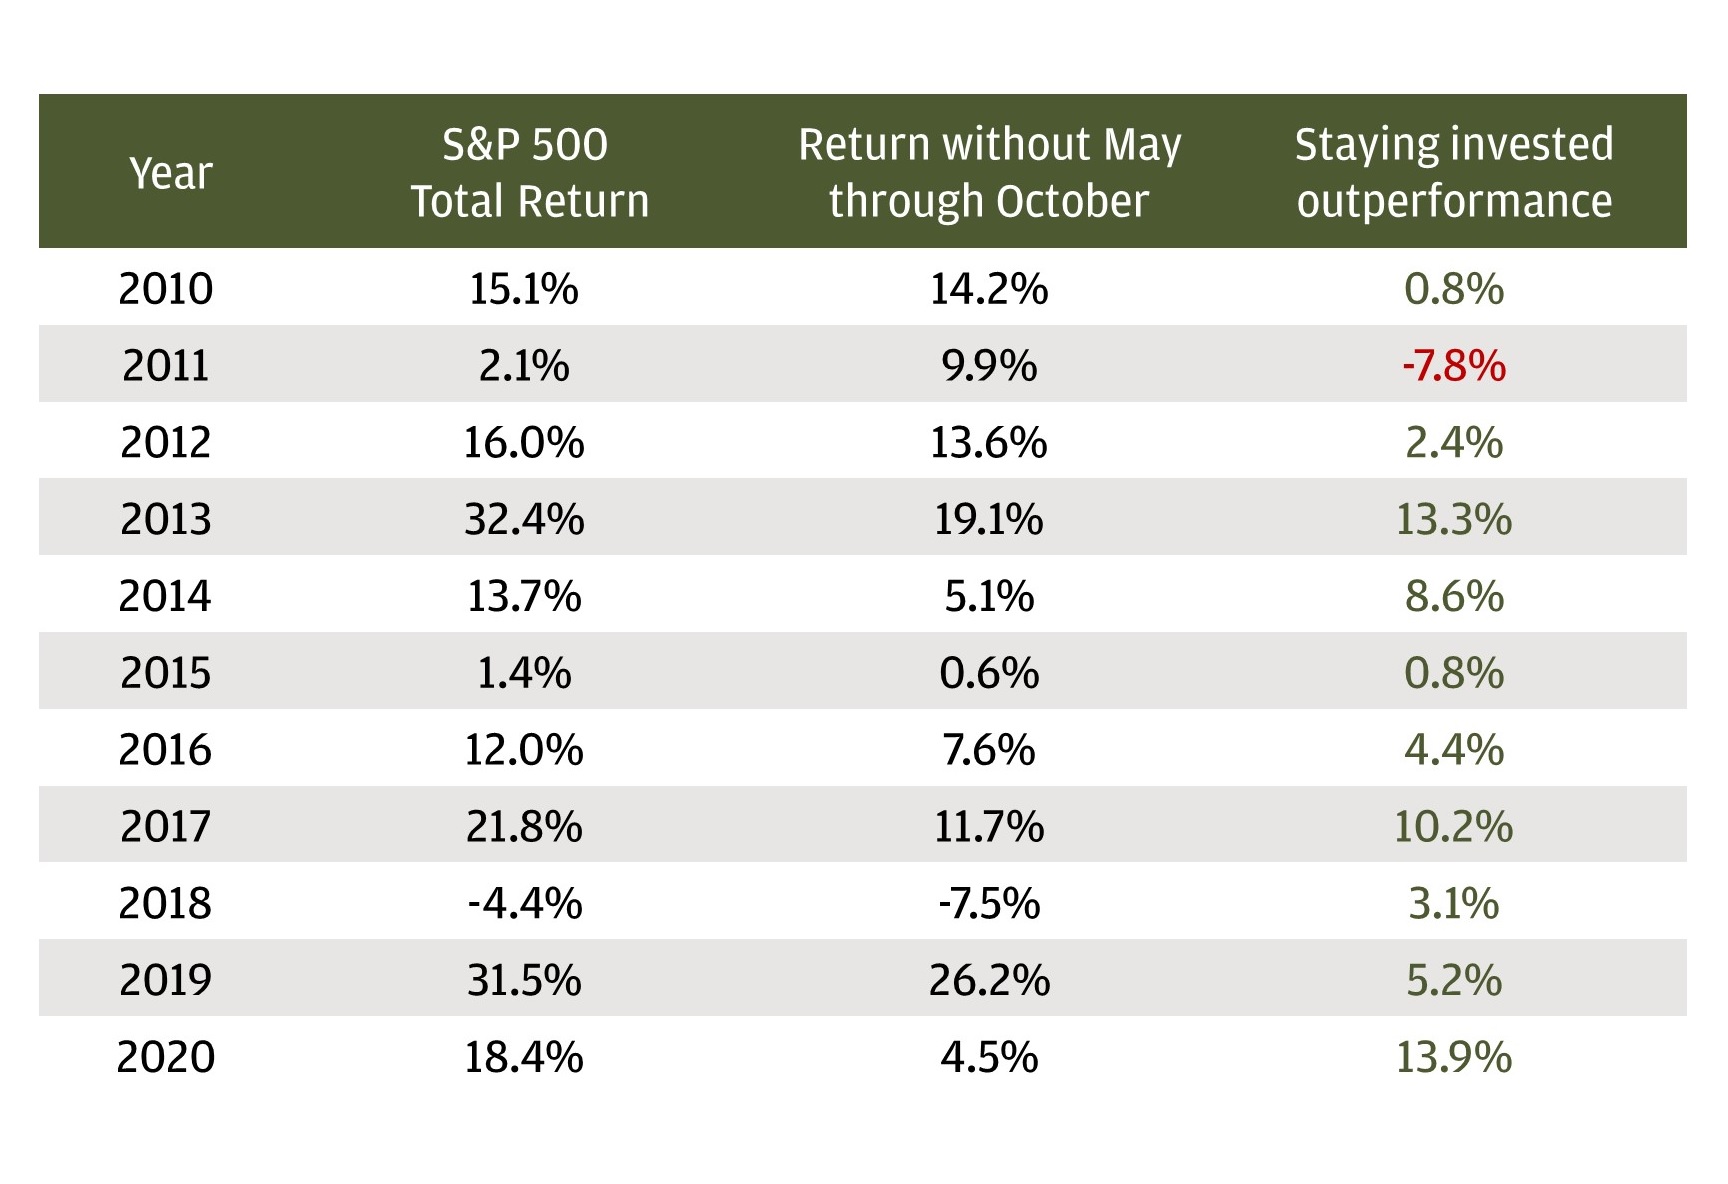
Interestingly, even though historical stock market returns tend to be stronger from November through April, the difference isn’t as much as you may think. In the past decade, 2011 was the only year in which divesting from the S&P 500 from May through October left you in a better position than if you had stayed invested.

Over the past decade, the only year in which “selling in May and going away” benefitted an investor was 2011

Table of annual data going back to 2010 to compare the S&P 500’s full-year total returns to what an investor’s total returns may have been if they divested from the S&P 500 from May through October.
Sources: FactSet, J.P. Morgan Private Bank. Data is as of December 31, 2020.
See expandable image , opens new browser window | Show text version, opens overlay

An alternative strategy to selling in May is rotation, whereby you vary your portfolio and focus on stocks that might be less affected by the seasonal slowdown in the markets, such as technology or health.


However, for most investors with long-term goals, keeping your equities yearlong is likely the best move. Not to mention the potential tax consequences it saves you from; selling stocks every April 30 may force you to pay short-term capital gains taxes that can eat away at whatever occasional benefit you might gain from “selling in May and going away.”

Invest your way

Not working with us yet? Find a J.P. Morgan Advisor or explore ways to invest online. 

Continue

Elana Duré

Editorial staff, J.P. Morgan Wealth Management

Elana Duré, is a member of the J.P. Morgan Wealth Management editorial staff. She was a markets writer for Investopedia prior to joining J.P. Morgan Wealth Management. At Investopedia, she covered finance and business news for the websit ...More

Elana Duré, is a member of the J.P. Morgan Wealth Management editorial staff. She was a markets writer for Investopedia prior to joining J.P. Morgan Wealth Management. At Investopedia, she covered finance and business news for the website and newsletters. Before that, she covered shareholder activism as a reporter at Reorg and Activist Insight, where she also hosted The Activist Insight Podcast. Her work has been published in The Washington Post, Chicago Tribune, and The Jerusalem Post.


Elana graduated magna cum laude from the University of Maryland, College Park with a B.A. in journalism and a minor in international development and conflict management.

Less

You may also like

Article Economic outlook What is the difference between a recession and a depression?

Economic downturns can affect growth, employment and more. But there is a major difference between a recession and a depression. Learn more about the nuances.

By Maxwell Guerra
8 min read
Top Market Takeaways

Article Top Market Takeaways Navigating market highs

New all-time-highs for the S&P 500 have investors wondering whether now could be a good time to invest – here's our take.

By Carter Griffin

Article Investing Essentials What is stagflation: An explainer

Stagflation is an economic condition that can be difficult for governments to manage. Learn more about it here.

By Seth Carlson
6 min read

Invest your way

From online investing to working with an advisor, J.P. Morgan is ready to help you achieve your goals.

Continue, to investment offers page.