Economic outlook Nothing is as good (or bad) as they say it is

- The Federal Reserve (Fed) has placed the start of rate cuts on hold. The trend of recent sticky inflation hasn’t been kind to policymakers. It’s going to take longer to achieve the confidence to ease.
- The easy part of getting inflation down from the highs is behind us. As Fed rate cut enthusiasm wanes, the European Central Bank (ECB) appears poised to drop policy rates in June.
- There have been quite a few headlines calling for the U.S. dollar’s demise. I continue to believe the dollar remains the one-eyed man in the land of the blind.
- Investors are on the right side of rational exuberance. While a lot of good news is priced into markets, it’s merited. However, return expectations need to be lowered.

“Nothing is as good as they say it is” is a song by the band Sparks. Nothing may be as good, but it’s seldom as bad either. Those are the guardrails investors are ping-ponging between: greed and fear, fear and greed. Recent moves we’ve seen in the bond market have been gripping and deserved. Growth is above trend, inflation is sticky. It’s where we go from here that matters.
I enjoy market moments when opinions vary. When investor sentiment is narrow and leans in one direction, bad things can happen. We seem to be moving from a narrow-minded ‘chase momentum’ minute, to hyperbolic investor cries of ‘the dream’s in the ditch.’
“Range bound markets” doesn’t make for a rousing headline or narrative, but “the dream of Fed rate cuts is slipping away” does. There is a pretense of precision about the next Fed move being to ease or tighten, in particular the actual number of cuts or hikes.
There is always risk of recession – statistically, it’s about 15% in any given quarter.1 Taking that as my starting point and adding on the chance of sustained below trend growth, I’d give that combination a 30% probability. We’re operating with a view that there is a 60% chance of a soft-landing in the U.S. A reacceleration to sustained above trend growth gets the residual 10%. I’d put plus or minus 5% bands around each of those base case figures.
The Fed has placed the start of rate cuts on hold. Short-term inflation argues for a longer pause before action. July is a possible starting point, but as the saying goes, it’s data dependent. The trend of recent sticky inflation hasn’t been kind to policymakers. The Fed lacks confidence that there isn’t more behind inflation. It’s going to take longer to achieve the confidence to ease. It’s all about confidence. It always is.
I will point out that the pivot in the market narrative to no rate cuts this year is brought by many of the same pundits that came into the year calling for seven rate cuts starting in March. There is nothing like a little headline grabbing sensationalism to capture the spotlight.
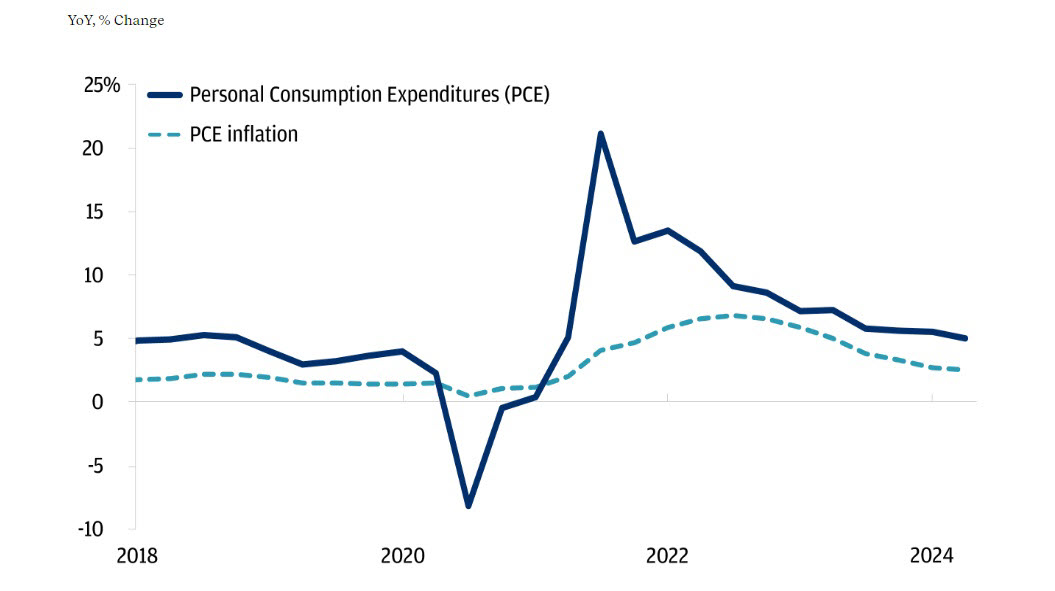
As we’ve worked our way lower in the inflation data, we’re also seeing a slowdown in consumption (Figure 1). We continue to see demand growing, just at a slower pace. We’ve had a significant backup in long-dated U.S. government bond yields. Investors are trying to figure out if that’s good news or not.
Inflation and consumption have been moderating
If the Fed turns out to simply be reactive to inflation data, we’re in a holding pattern. However, what if there’s an element of wanting to be proactive, to ensure they’re not breaking the economy by overstaying their ‘high rate’ welcome? If I were sitting at the policy table, I’d want to make sure I tame inflation and not slam the growth breaks too hard. The Fed’s job is to contain inflation and maintain full employment.
‘Why hurry’ is a fair storyline for when the Fed begins to ease. But we have a U.S. election cycle gearing up. The Fed is apolitical, but just as nothing is ever as good as it’s spun, no one is as apolitical as asserted. Policymakers are politically conscious. They need to be.
Current yields neither surprise nor worry me. How quickly we got here does. If we push markedly higher, risk assets may rumble. So far, they’ve been well-behaved.
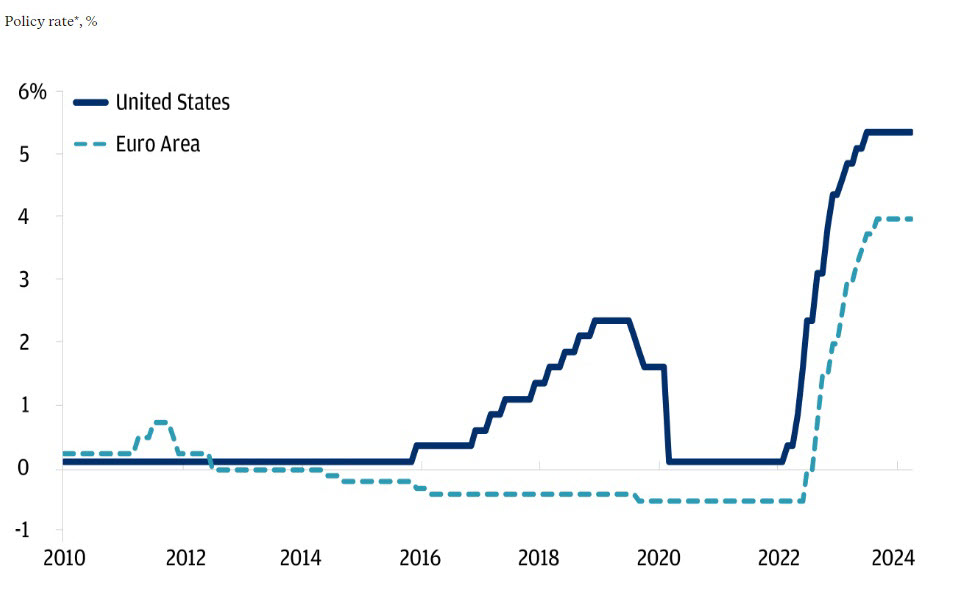
So you’re saying there’s a chance? Always. As Fed rate cut enthusiasm wanes, the ECB appears poised to begin lowering policy rates in June (Figure 2). As President Lagarde pointed out, the ECB is data, not Fed, dependent. Well yes, until they’re not.
The Fed and ECB have kept policy rates on hold
I believe the ECB will cut faster than the Fed. In non-dollar portfolios, it’s in part why we’ve kept a modest U.S. dollar overweight. It was also an input in closing our underweight to European equities in February. The ECB isn’t explicitly Fed dependent, but they care about the pace and amount of Fed easing. So do investors.
I expect the disinflationary path we’re on to be bumpy. The easy part of getting inflation down from the highs is behind us. The data argues for the Fed’s holding pattern, with an eventual bias to ease. That base case view is foundational to why portfolios are procyclically positioned.
Equity and bond markets could benefit from hitting pause. Too much momentum is never healthy. ‘Excess’ exuberance has tempered Alan Greenspan’s ‘irrational’ as the current market caution cry – excess being less acute than irrational. As we move past peak earnings growth, multiples won’t be able to carry the market at the stride we’ve recently seen.
For the recessionists that screamed “duck and run” last year, adjusting the tone of their negative messaging is understandable. I’ll add that analyst revisions higher of ‘too low’ equity market targets is also merited. But we’re starting to step into a world where each time we set a new market high, analysts revise forecasts even higher.
I’ve begun to see forecasts inched up as high as 6000 for the S&P 500. Sure, we have the potential to get there. Greed is good, until it isn’t. At that point, markets will have moved from being a weighting to voting machine. If we quickly race towards 6000, it’s going to feel like 1999 redux.
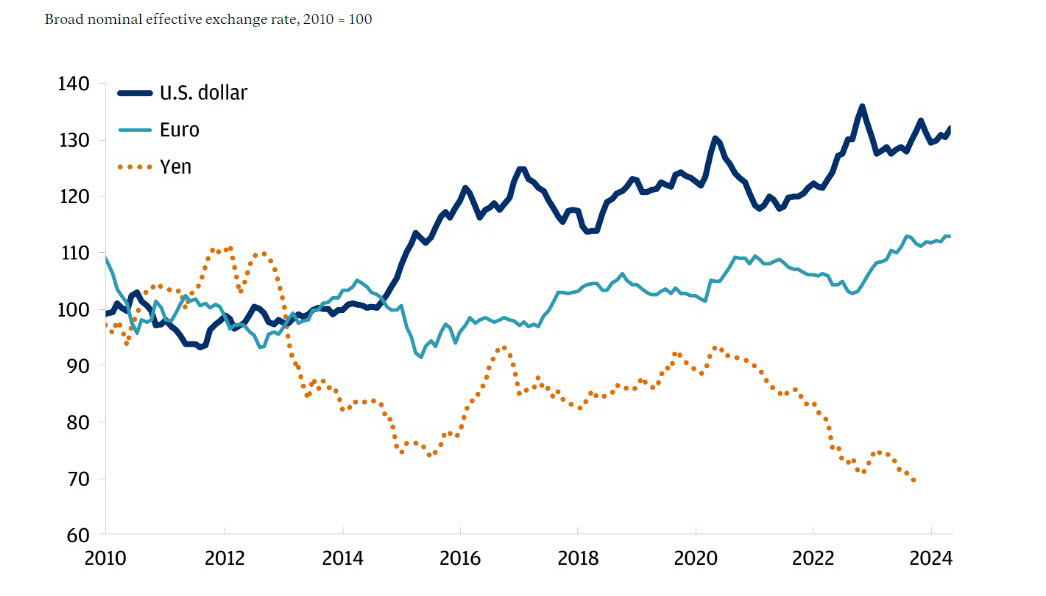
Dollar exceptionalism. There’ve been quite a few headlines calling for the U.S. dollar’s demise. I’ve been keeping an eye on foreign exchange markets, specifically the yen. I’ve made my case before for why I believe the dollar remains the one-eyed man in the land of the blind (Figure 3). The Fed’s on hold, other central banks are getting ready to ease and the Bank of Japan (BoJ) seems stuck in a moment.
The U.S. dollar remains resilient
Why care about the yen? It’s a primary reserve currency that can easily rattle global markets. Japan is the largest foreign holder of U.S. government bonds, with $1.1 trillion of Treasury securities. Something to keep in mind.
Japan moved away from negative interest rates this year. The question’s been whether they will hike policy rates further. Yen weakness continues to foster debate.
Direct yen intervention can stymie dollar/yen gap risk. That’s my reference to the peril of investors leaning in one direction – shorting the yen. Intervention inflicts immediate pain on punters. It doesn’t stop them from selling, it simply slows them down.
The undercurrent here is interest rate differentials. If Japan wants the yen to stabilize, policy rates need to move higher. That doesn’t appear to be happening anytime soon. With the ECB expected to cut ahead of the Fed, I expect current euro weakness to also prevail.
A time out. Earnings continue to surprise to the upside. That said, we’ve seen broadening dispersion across individual names. Within portfolios, we continue to tactically favor financials, technology and healthcare. Specifically: big banks and insurers, semiconductors, software, biotech and life sciences.
We’re constantly meeting with companies to better understand their businesses and senior managements’ outlook. Globally, we have over 300 meetings with companies each year. It’s a rigorous input to the team’s investment process. Those meetings inform our macro views.
We remain procyclically positioned in portfolios. We’re overweight equities, funded from core bonds. We retain an overweight to the U.S. equity market as well as extended credit, including emerging markets debt.
Investors remain on the right side of rational exuberance. As markets have ramped up excitement, it’s being built on a solid foundation. Earnings are strong, balance sheets in aggregate sound and market technicals supportive, with corporate buybacks and dividend payouts on an upswing.
While a lot of good news is priced into markets, it’s merited. That may take an edge off what’s been growing skepticism about the durability of the macro and market cycle. Valuations across equity and credit markets continue to make sense. However, return expectations need to be lowered.
We’re intentionally balancing out the tactical tilts we have in portfolios. Currently, I don’t want to be holding any single large risk position. Market valuations and the macro environment don’t argue for it. That leaves us with the ability to opportunistically add risk in a market correction, should we get one.
At the right price, we’re buyers of risk assets and duration. The price isn’t right. Bonds seem fairly valued; risk assets aren’t cheap enough to go further overweight. It feels like we have a choppy few months ahead. Bouncy, but hopefully broadly range-bound. A time out would serve investors well. It seems to be working out for the Fed.
Invest your way
Not working with us yet? Find a J.P. Morgan Advisor or explore ways to invest online.
Richard Madigan
Chief Investment Officer, J.P. Morgan Wealth Management
Chief Investment Officer, J.P. Morgan Wealth Management
Richard Madigan is Chief Investment Officer for J.P. Morgan Private Bank and Wealth Management. In this role, he is responsible for the development of investment strategy, tactical and strategic asset allocation for over $450 billion in ...More


Footnotes
-
1
Federal Reserve Bank of St. Louis, “Can Economists Predict Recessions?” (September 2023)