Economic outlook Are banks vulnerable to a crisis in commercial real estate?

By Joe Seydl, Senior Markets Economist, Jay Serpe, Global Head of Alternative Investments, Strategy & Business Development and Ryan Asato, Manager Solutions, Alternative Credit
Renewed stress in the banking industry has a way of focusing the mind.
Since March, when the abrupt and unexpected failure of two regional U.S. banks, Silicon Valley Bank and Signature Bank, rocked U.S. markets, investors have begun voicing concerns about the balance sheet vulnerabilities of regional banks – and more specifically, their exposure to commercial real estate (CRE).
Those concerns have some merit. Compared to big banks, small banks hold 4.4 times more exposure to U.S. CRE loans than their larger peers. Within that cohort of small banks, CRE loans make up 28.7% of assets, compared with only 6.5% at big banks.1 More worrying, a significant percentage of those loans will require refinancing in the coming years, exacerbating difficulties for borrowers in a rising rate environment.
Just how worried should you be? To help cut through the noise, we delve into commercial real estate to explain ongoing industry trends and how we expect them to impact different subsectors in the quarters and months ahead. Some of those shifts, such as the widespread adoption of hybrid work patterns post COVID-19, are still creating powerful headwinds for the office sector, which is particularly – although not uniformly – vulnerable. Other trends, such as the rise of e-commerce, continue to provide tailwinds for industrial assets, including logistics properties and warehouses. Reshoring – the process of bringing production and manufacturing of domestic goods back into their country of origin – could also benefit the industrial sector.
Here’s our main takeaway: The office sector faces its own particular set of challenges. Many other sectors within CRE have stronger fundamentals. Nor do we believe that potential losses within the office sector are likely to destabilize regional banks. From both a GDP and wealth perspective, the office sector represents a small part of the overall economy.
That said, the small bank lending channel more generally does represent a macro risk, as tighter lending standards and profitability challenges in the banking sector could reduce available financing and raise the cost for small and medium sized businesses. But it’s difficult to quantify this risk precisely, and the uncertainty surrounding potential offsets is high.
Worsening conditions challenge the office sector
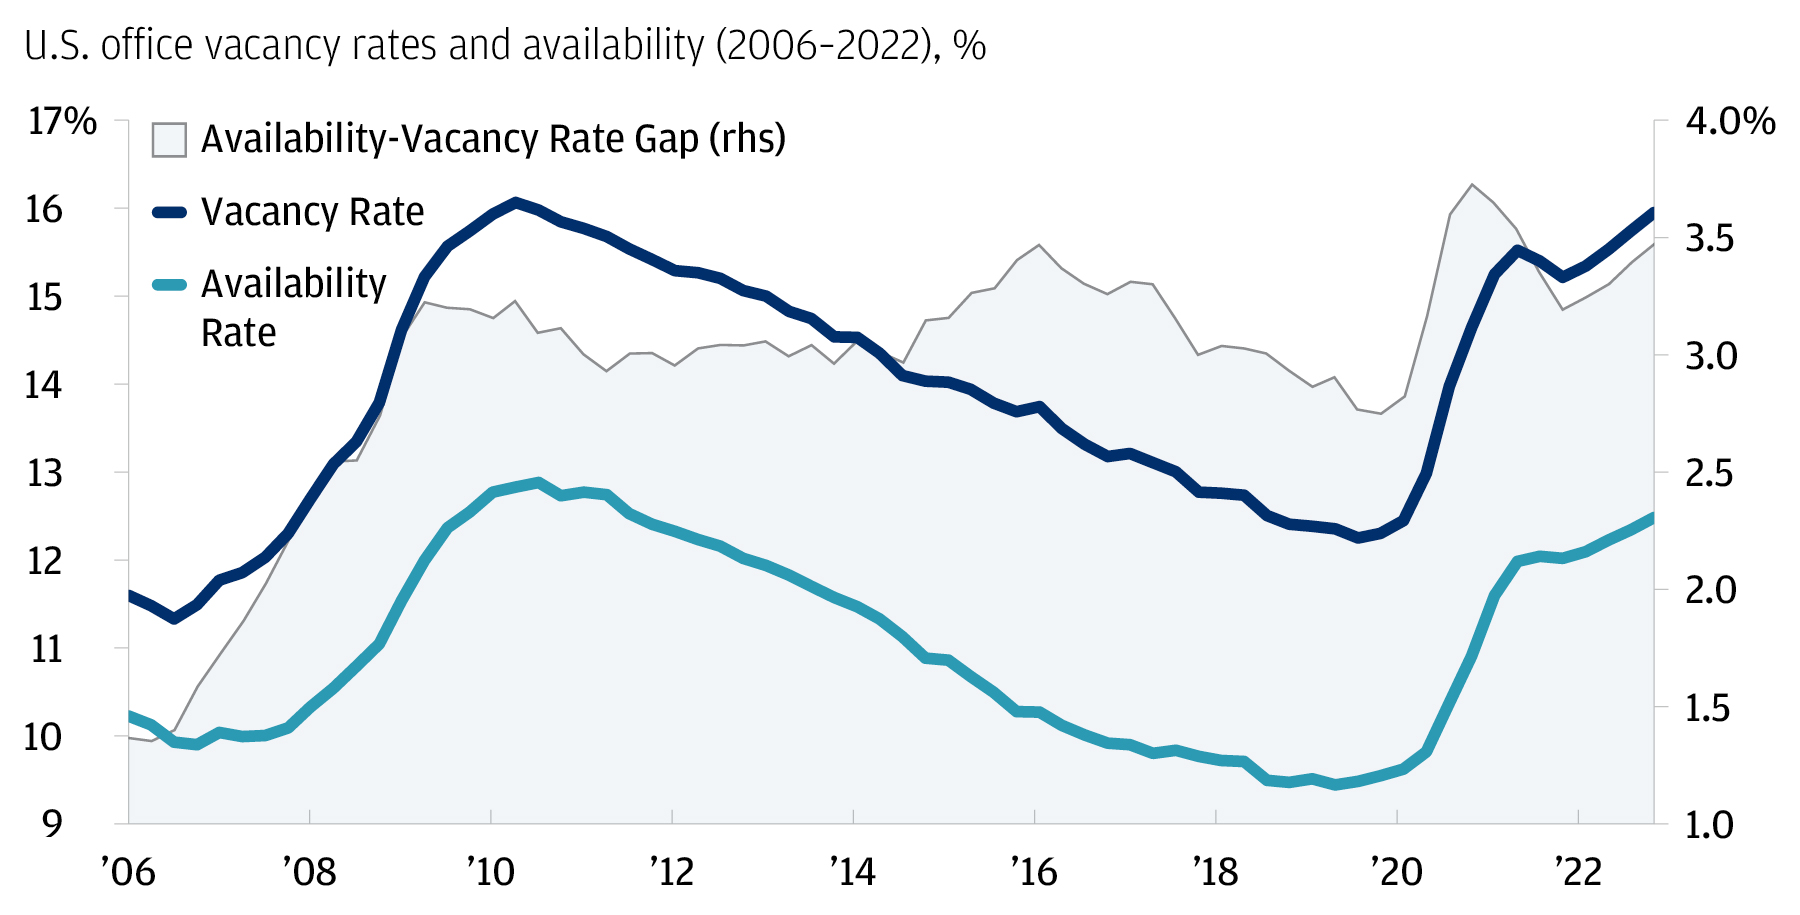
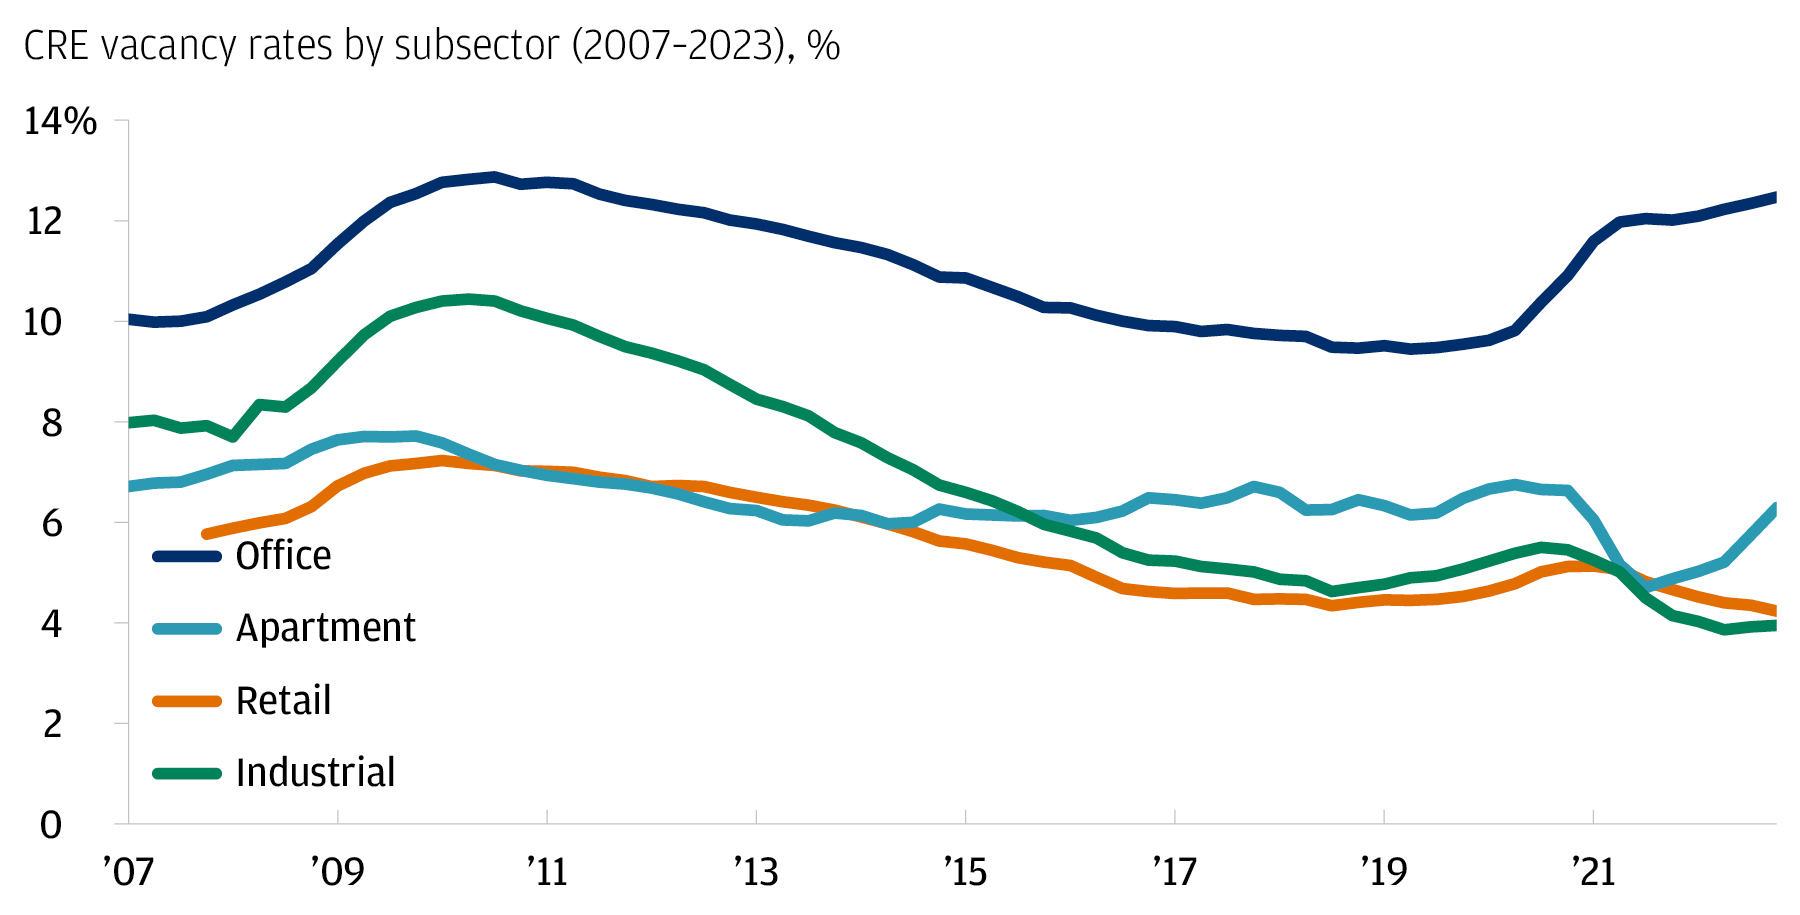
Make no mistake: Rising rates are piling pressure on the troubled office sector. Vacancies soared in the early stages of the pandemic and have kept rising since. Today, as shown in the chart below, the office vacancy rate of 12.5% is comparable to where it was in 2010, one year out from the global financial crisis (GFC). Office sales volume is now approaching its post-GFC lows.
Office vacancies rose when the pandemic hit, and have kept rising since
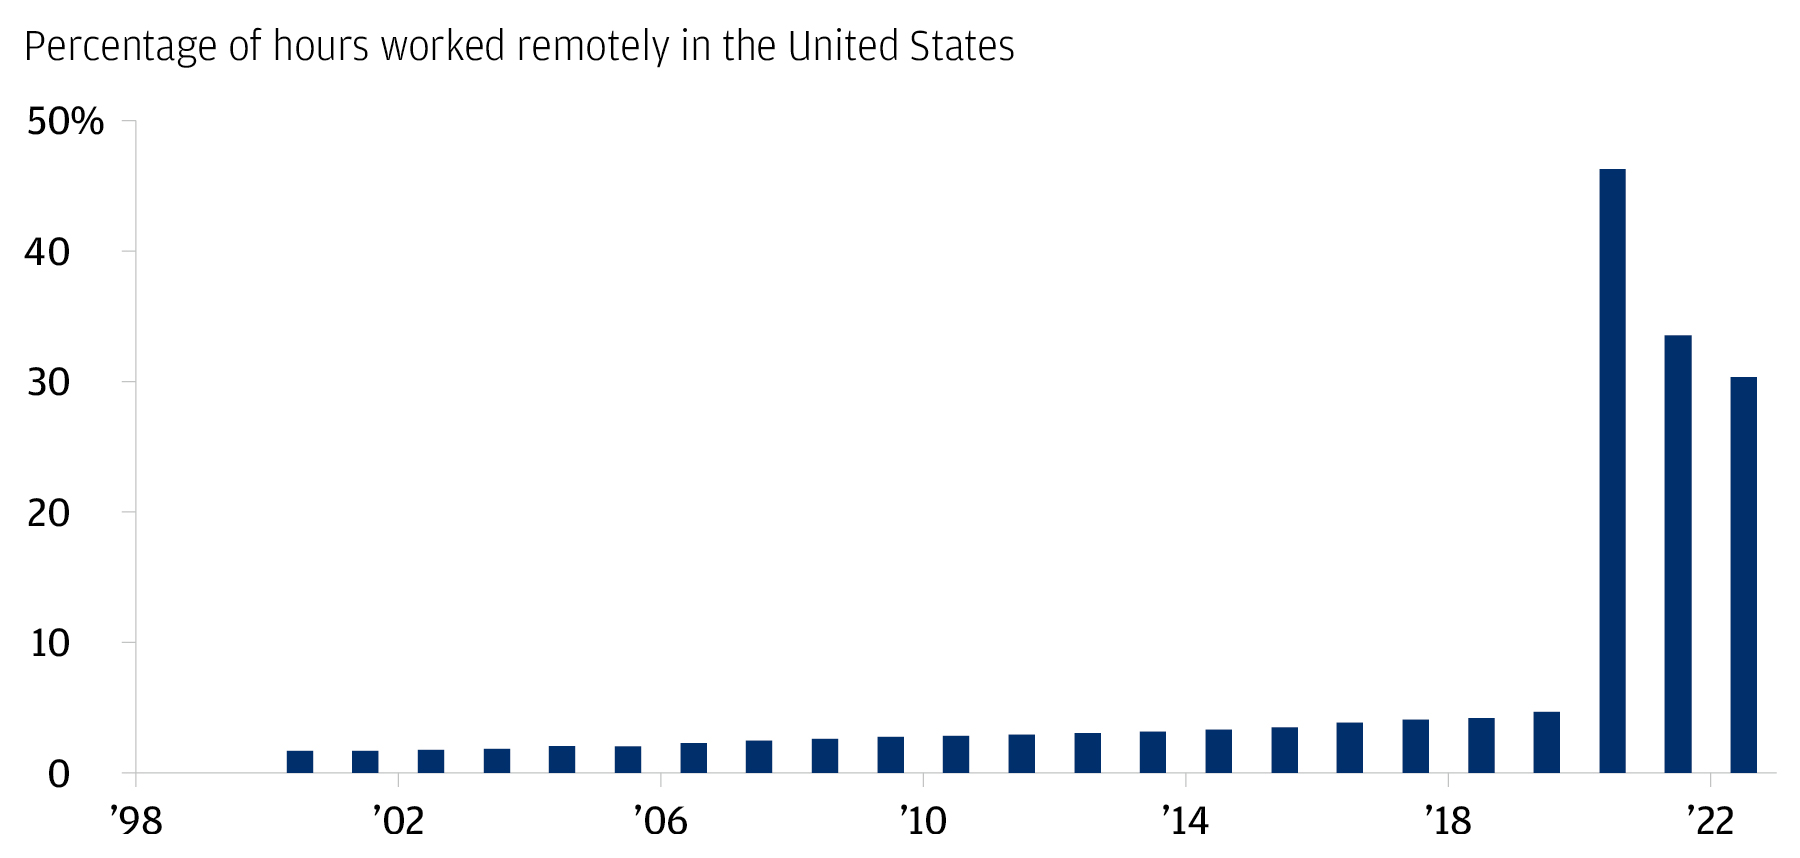
The primary source of these challenges is the rise of remote work. Although more employees did return to offices in 2022, the outright level of remote work remains seven times higher than it was in the pre-pandemic era. Layer on top of this the Federal Reserve’s historically rapid pace of interest rate rises over the past year, plus accelerating layoffs in professional and business services (e.g., in the technology sector) and the obsolescence of older office buildings, and it’s not hard to see pain in the office sector getting worse.
Employees are gradually returning to offices, but the level of remote work remains historically high
Investors need to remember, however, that the office sector is bifurcated. Difficulties are emerging by geography – Chicago and San Francisco are much more challenged than Miami, Raleigh and Columbus, for example – and differentially affecting property vintages. Newer office builds, particularly those built after 2010, are seeing much stronger net absorption rates than older builds.2
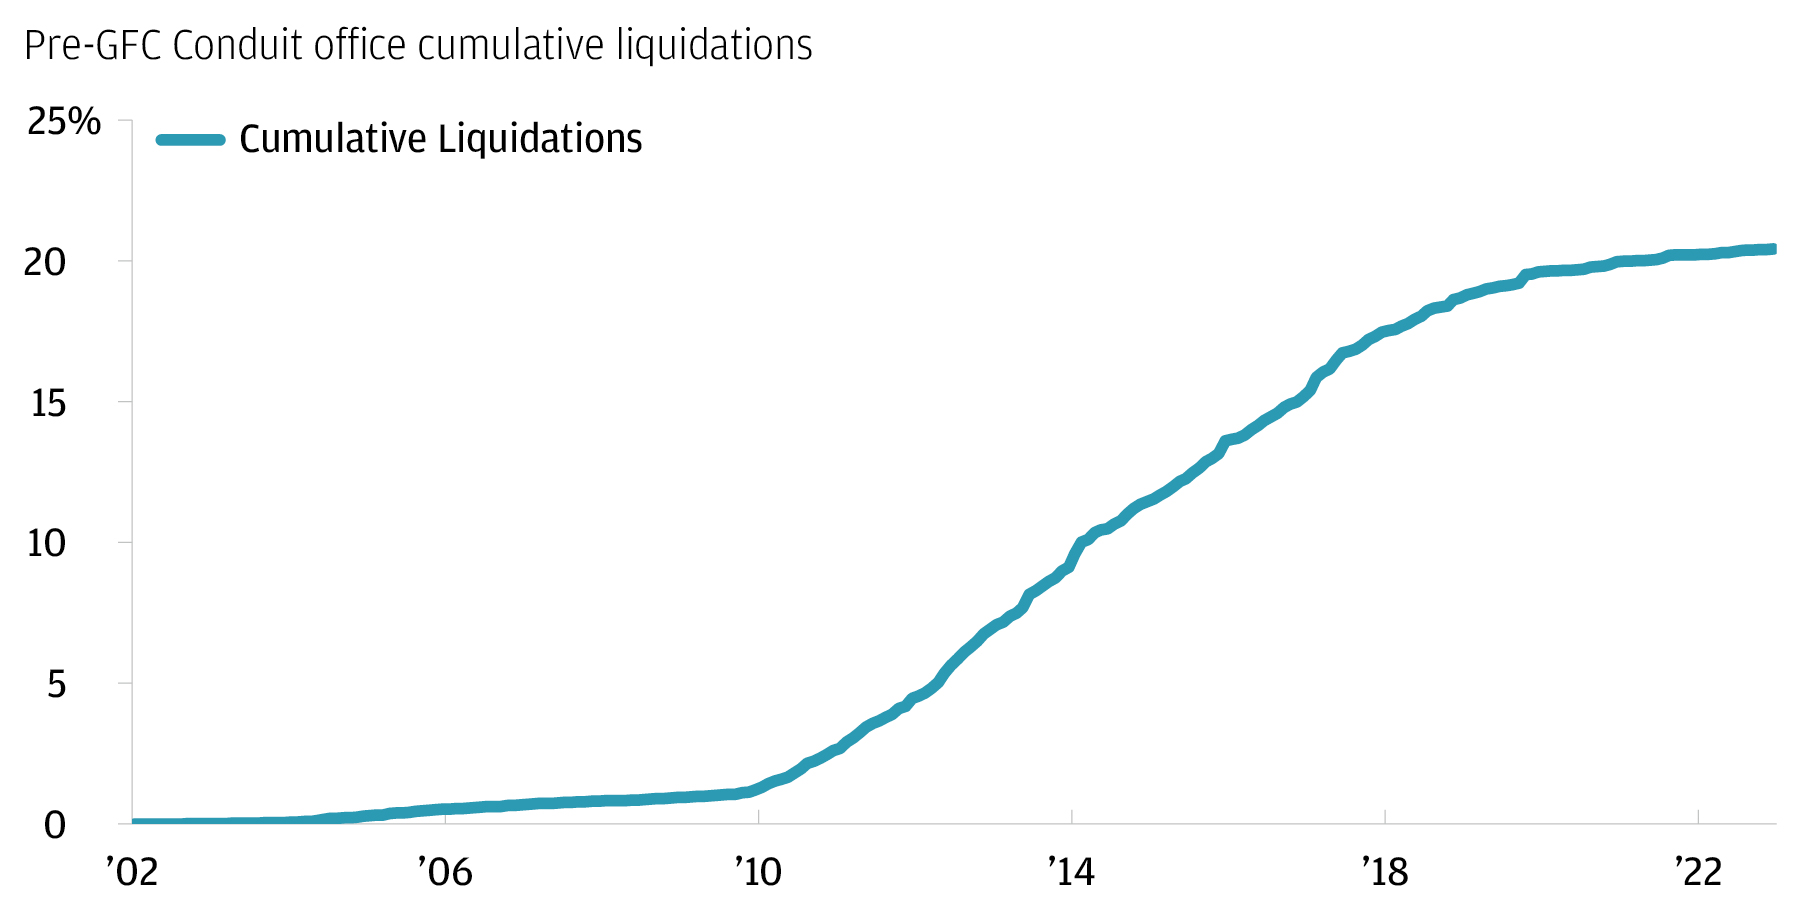
Inevitably, the tightening of credit availability and higher rates will spell trouble for some borrowers. Although the liquidation rate in the sector is low at present, we expect cumulative liquidations of commercial mortgage-backed securities (CMBS) for the office sector to rise to approximately 20% over the next 10 years (with cumulative losses expected to be approximately 8.5%).3
This level of distress is comparable to percentages seen in the sector in the post-GFC years (chart below), but – importantly – it will likely take many years to play out.4 In the short run, borrowers will likely take advantage of loan extension options. Looking further out, we expect to see CMBS loan maturities become more challenging by 2025–2027.5
Liquidations take time
The risk transmission mechanism: Rising rates can quickly erode valuations
Before putting the office sector in broader context, it’s worth reminding ourselves of the risk transmission mechanism at work in commercial real estate, because central bank policy affects even the most carefully selected properties. CRE assets are very long duration in nature, so their values are particularly sensitive to interest rates. But how, exactly, do higher interest rates – holding everything else constant – erode the value of a particular building?
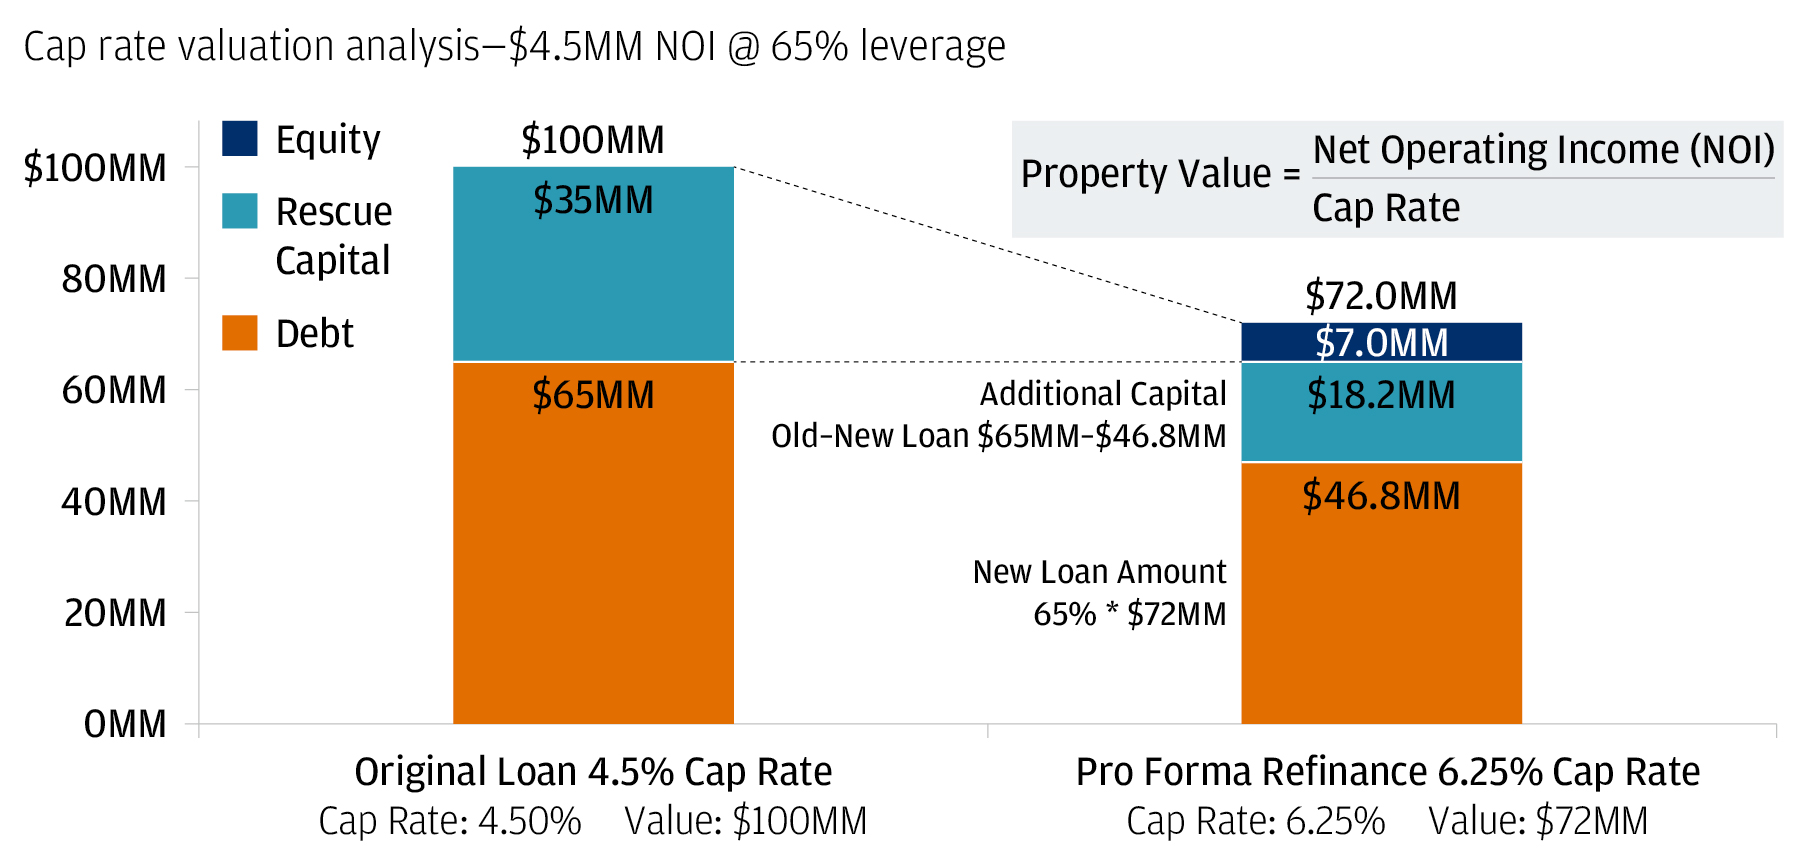
To answer that question, we need to look at the impact that higher capitalization rates (cap rates) have on commercial property valuations. A cap rate measures a property’s net operating income (NOI), revenue less operating expenses, divided by its market value. A high level point-in-time metric used to value CRE is to take a property’s net operating income and divide that by its cap rate.
In the chart below, our hypothetical example shows how the value of a $100 million office building would decline to $72 million if cap rates increased from 4.5% to 6.25% (holding NOI constant). If the borrower were to look at refinancing the loan at this lower valuation, keeping the loan-to-value ratio constant, the borrower would have to contribute an additional $18 million in equity to get the refinancing done.
Even when net operating income remains constant, higher cap rates erode property valuations
This example demonstrates just how vulnerable commercial real estate is to rising rates. If, in the months to come, the Federal Reserve (the Fed) raises rates even higher, some borrowers will likely struggle – and be unable or unwilling to provide additional capital to extend the life of their loans. Depending on the borrower and property fundamentals, however, that mismatch might not necessarily force borrowers to hand back their keys: Given current market conditions, we believe lenders are unlikely to repossess commercial properties that they would have to either manage or sell, especially at stressed valuations.
Instead of foreclosing, lenders may offer borrowers short-term forbearance or even modify their loans. After all, banks do have the flexibility to either extend a loan’s maturity, take a discounted payoff, or accept what’s known in the trade as a “deed in lieu” of foreclosure, which conveys all interest in a property to the lender to satisfy a loan that is in default.
Looking back at the early ’90s: CRE price cycles vs. GDP
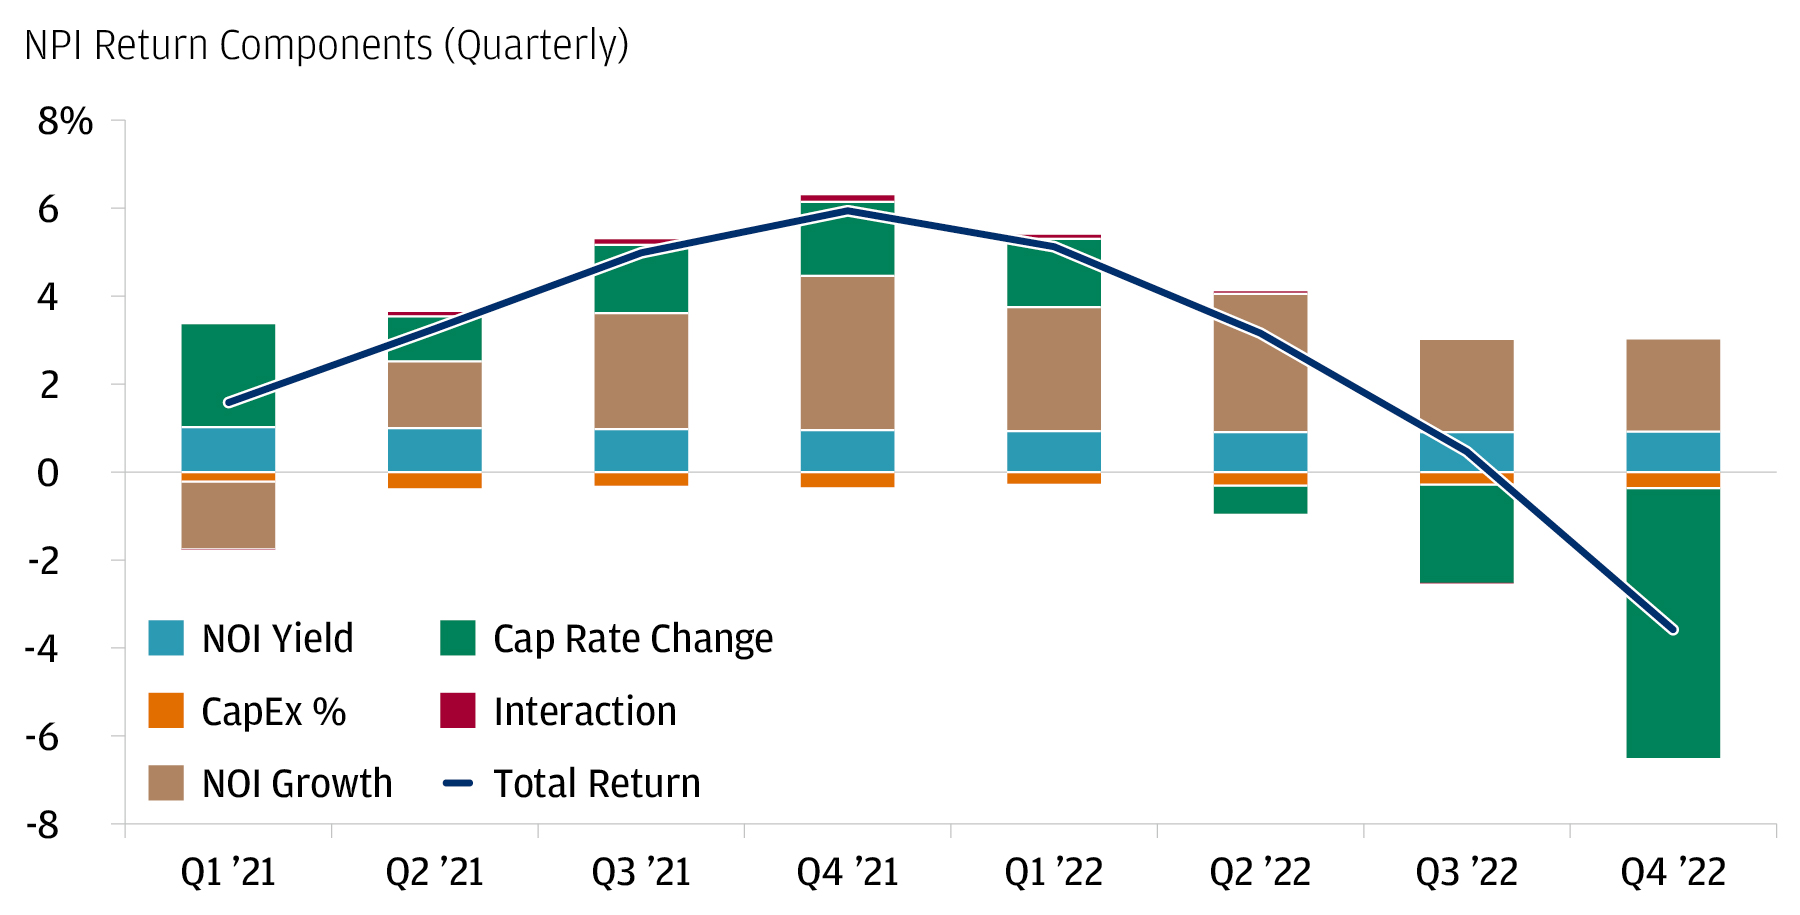
Across all sectors, commercial real estate returns are currently down only about 3.5% from their peak in 2021, according to the National Council of Real Estate Investment Fiduciaries (NCREIF). The composition of CRE returns in recent quarters suggests the decline has been entirely due to higher cap rates, as opposed to weak NOI growth (chart below). To the extent that interest rates remain higher than they were pre-pandemic and economic growth continues to slow, we will likely see more price deflation in CRE going forward.
Recent CRE return patterns suggest that declines are due to higher cap rates
However, history suggests that CRE down cycles are less detrimental to GDP than residential real estate down cycles, given less spillover to the consumer.
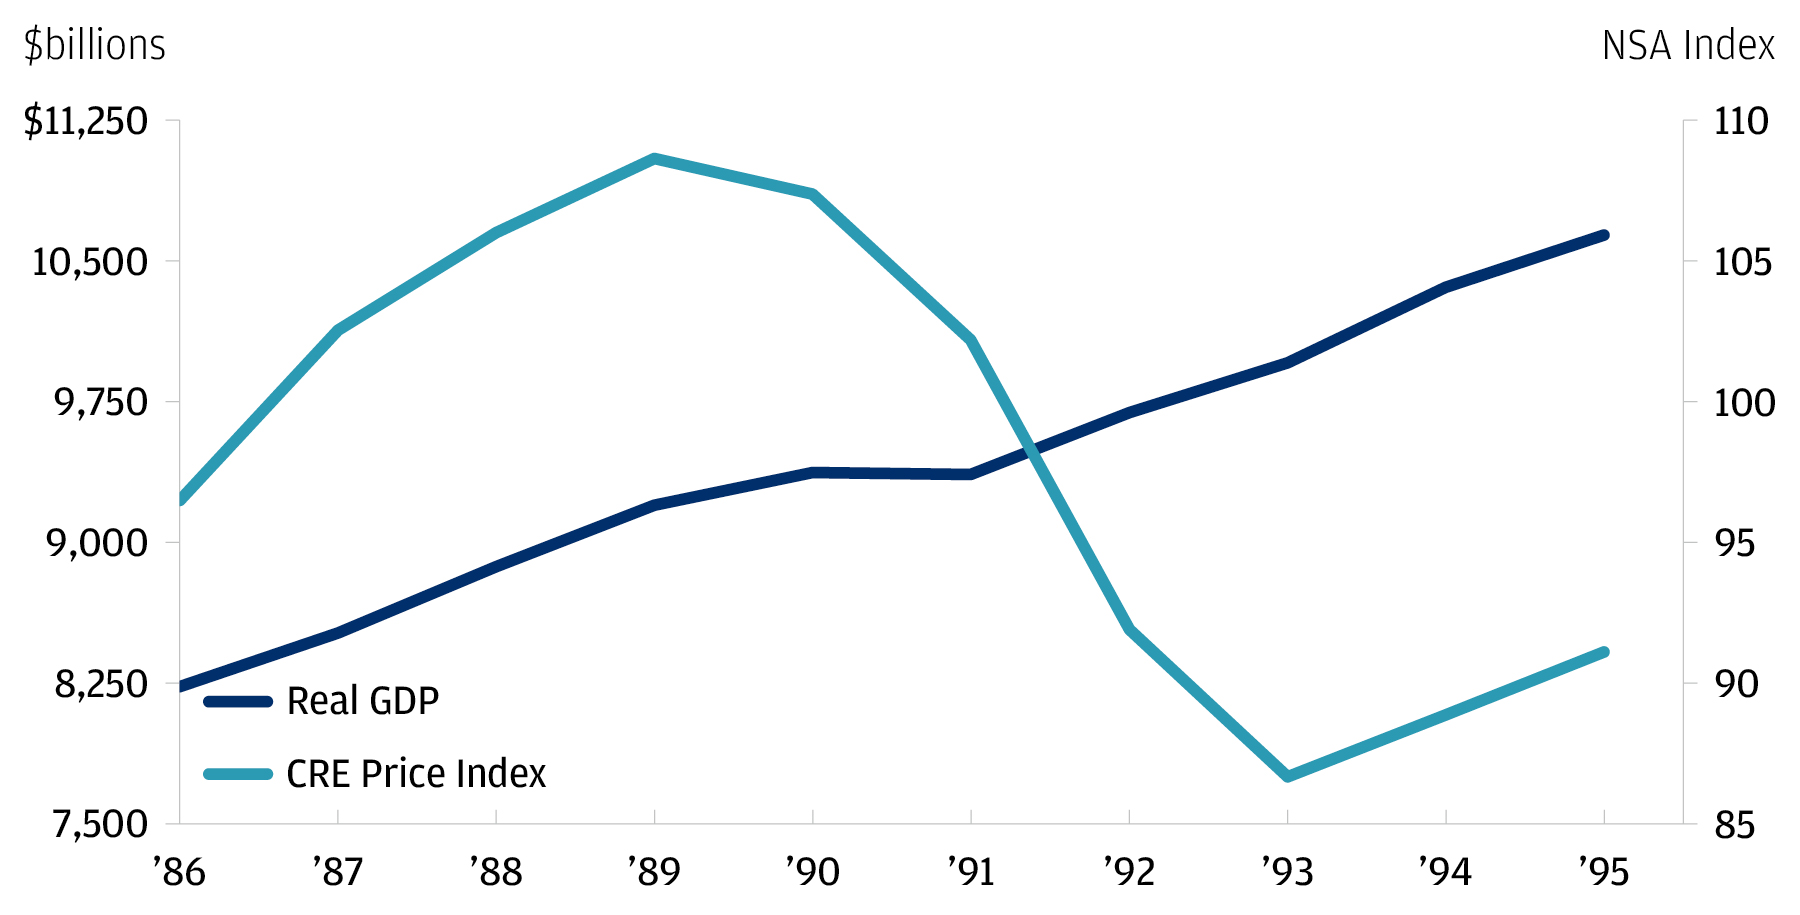
The early 1990s recession offers a good example of this dynamic: Between 1989–1993, CRE prices fell by more than 20% from peak to trough, but – at the same time – the U.S. economy experienced one of the shallowest recessions in history, with real GDP falling by only 0.1% in 1991 (chart below).
In the 1990s, a large drop in CRE prices coincided with a shallow recession / U.S. real GDP vs. CRE price index (1986–1995)
Differentiating within and across CRE sectors
Within the commercial real estate complex, the office sector is unique for its high and rising vacancy rate. Occupancy in other CRE sectors, most notably industrial and retail, remains tight, with vacancy rates well below pre-pandemic levels. Construction activity in the industrial sector has been booming; the current level of construction is at a secular high relative to GDP (charts below).
Within CRE, the office sector is experiencing the highest percentage of vacancies
With the rise of e-commerce, industrial property development in the U.S. has reached a secular high
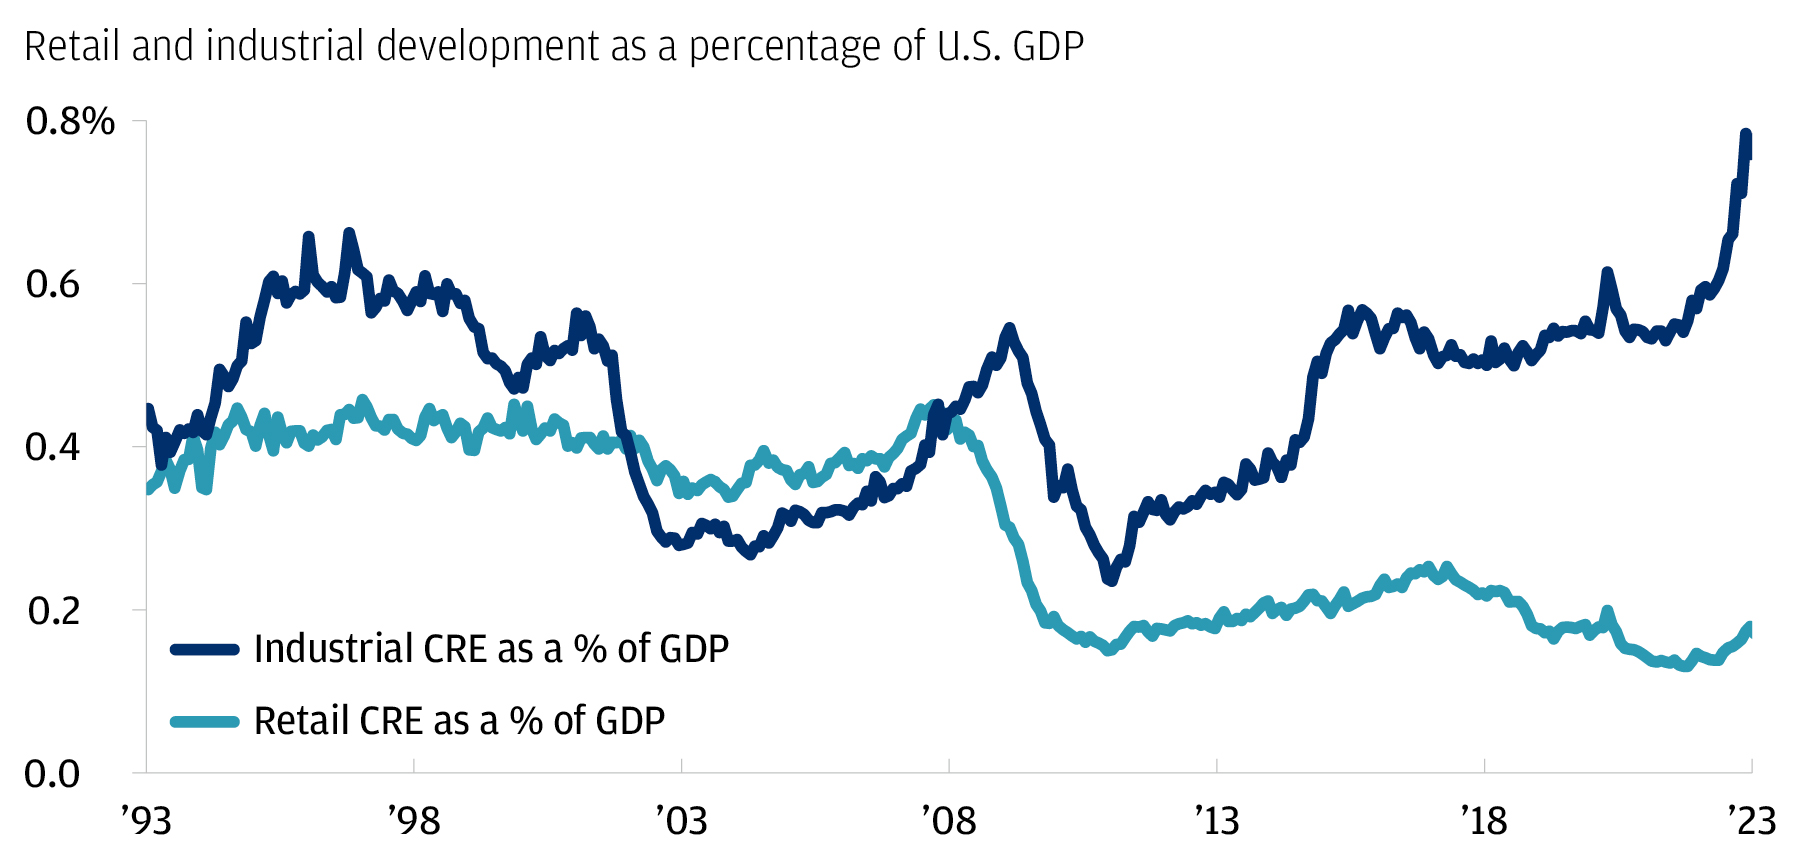
Retail, on the other hand, is experiencing some headwinds, even though the vacancy rates are comparatively low. Ever since the GFC, retail construction projects have languished, in large part due to rising e-commerce activity, which creates more demand for logistics properties, such as warehouses, and less demand for brick and mortar assets.
In aggregate, retail is in a better place today than it was immediately after the GFC due to a lack of supply, but there are still challenges – especially for lower-quality assets, such as class B and C malls.6 Distress continues to be high in this subset of the CMBS market, which accounts for approximately 5%–10% of the overall market.7 Looking ahead, the resilience of the retail sector will largely depend on the confidence of the U.S. consumer over the next 12 months, despite an elevated probability of recession.
Although the apartment sector experienced tight market dynamics in 2021 and the first half of 2022, demand has now cooled: Vacancy rates are now close to where they were prior to the onset of the pandemic. This is largely a function of a slowdown in migration patterns across the U.S. Household formation has also slowed.8
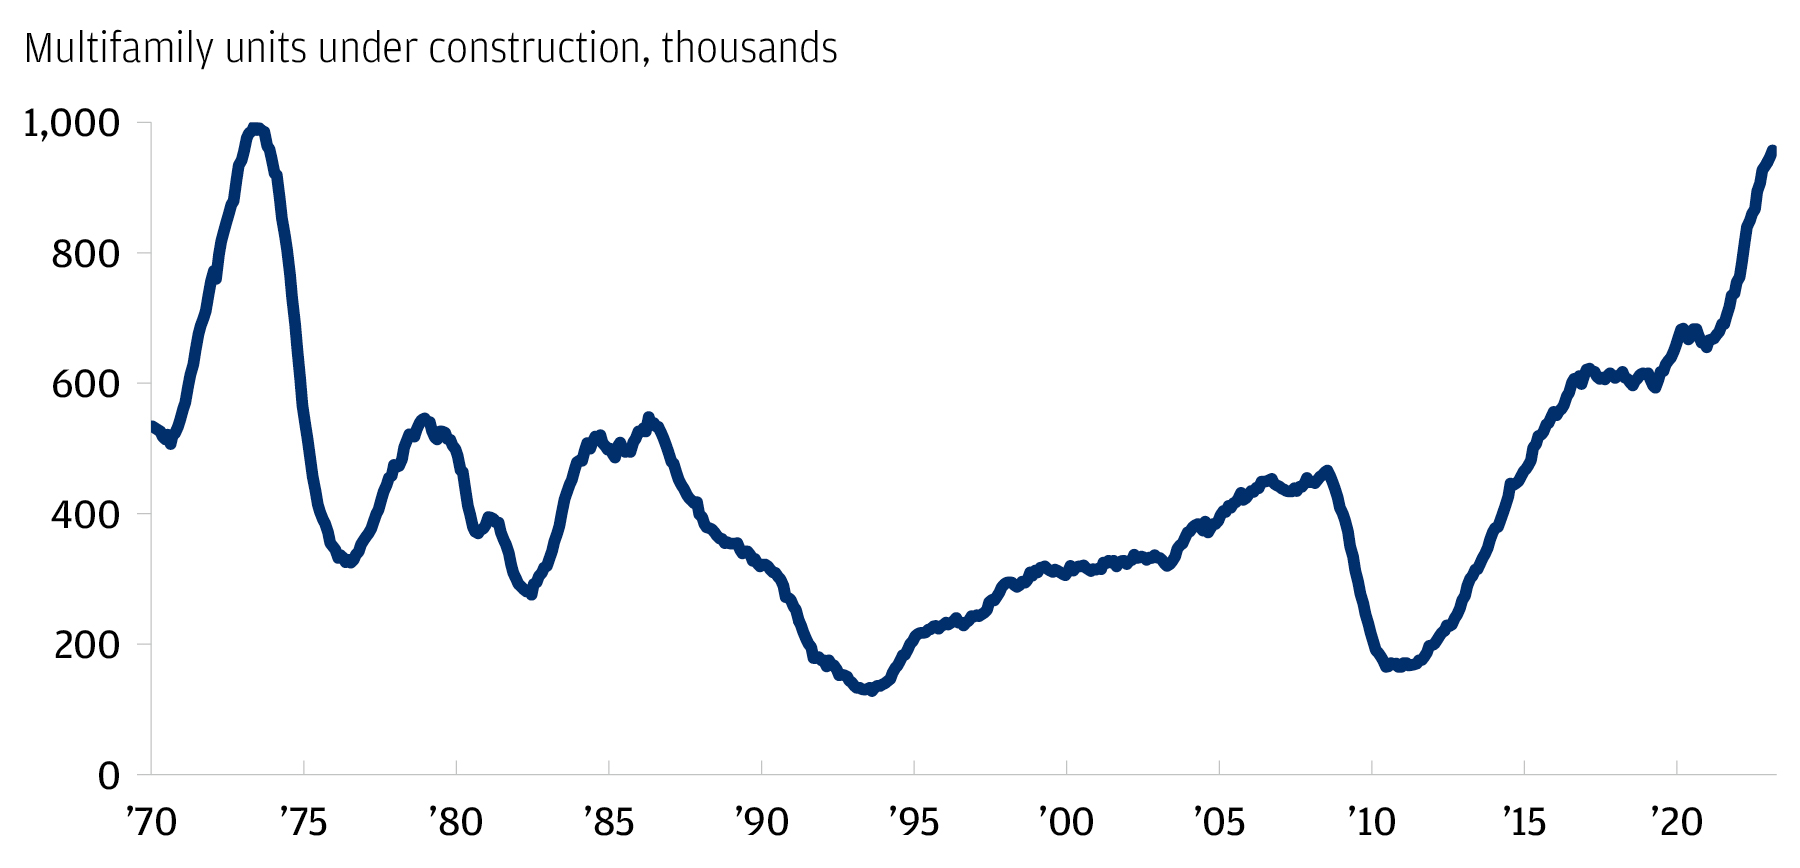
We expect the apartment market to continue to loosen, especially as additional supply becomes available. Currently, more than 950,000 multifamily projects are under construction across the U.S., the highest level of activity since the 1970s (chart below). We believe demand, however, is unlikely to collapse as it has in the office sector given favorable secular dynamics, including renting trends among Millennials, who are facing the worst homebuying conditions in 40 years.9 Here again, demand is becoming increasingly bifurcated as rental markets in the South and Southwest remain strong, while coastal markets soften in the wake of recent tech industry layoffs.10
The number of apartments being built in the U.S. is higher than at any time since the 1970s.
How would a CRE crisis impact the broader economy?
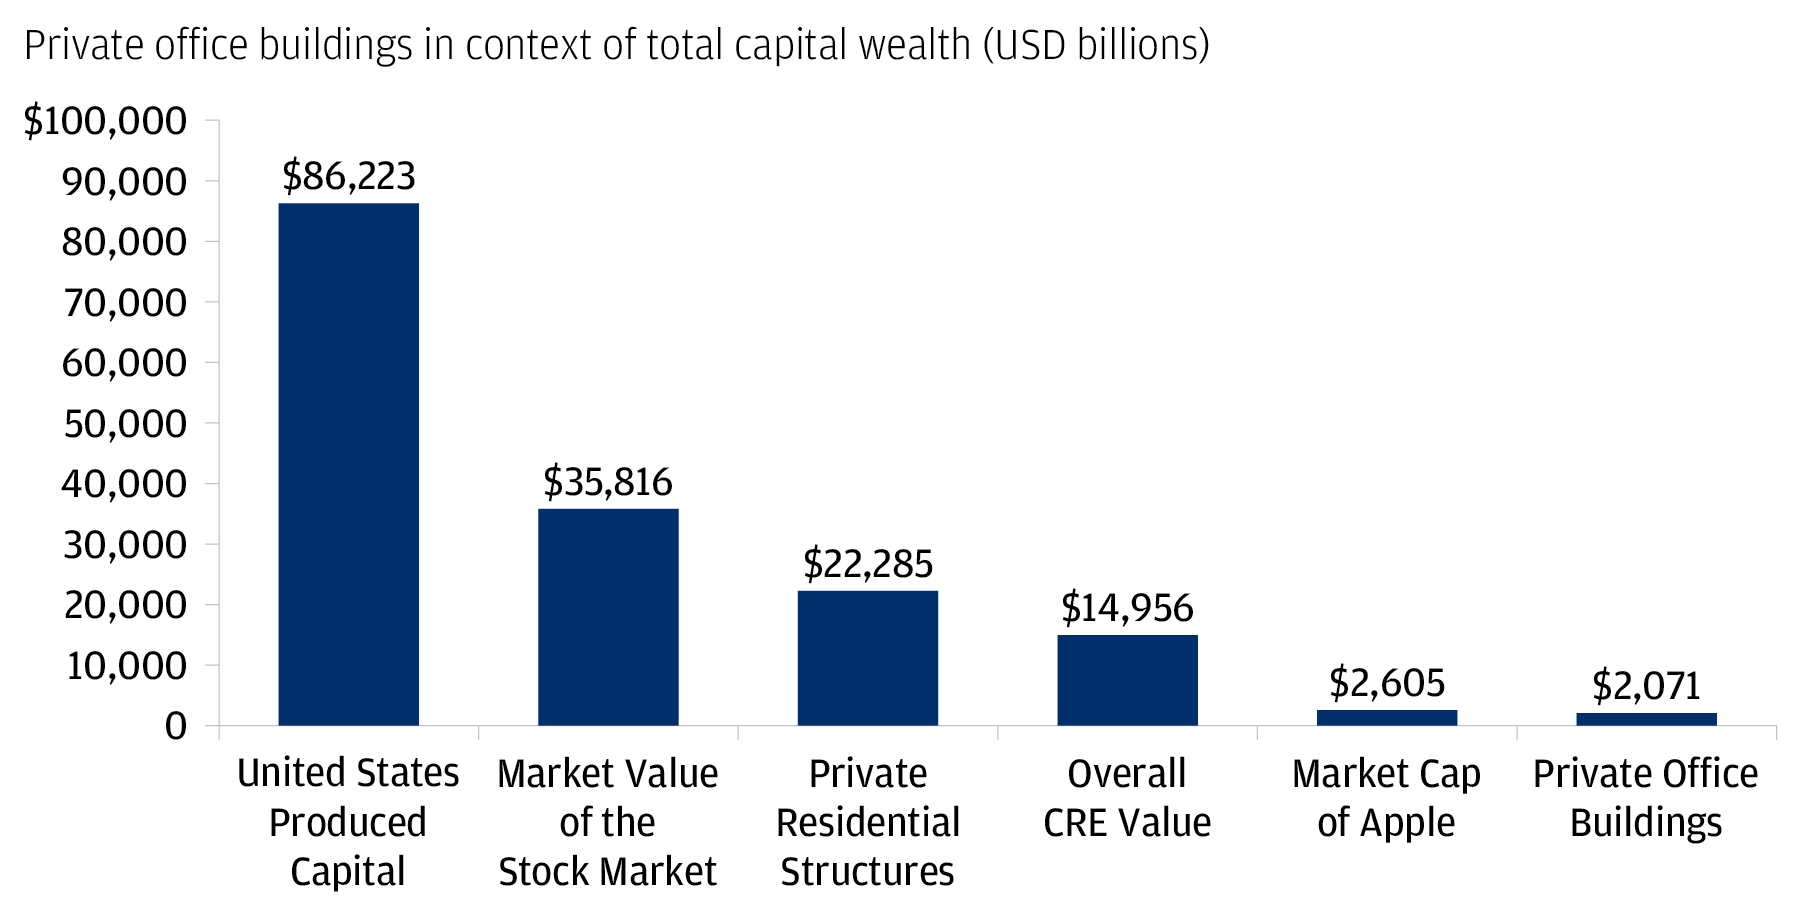
If we zoom out of CRE and contextualize the office sector in the broader U.S. economy, the backdrop becomes reassuring. From a wealth perspective, office assets represent a low share of the value of all physical capital across the country, at only 2.4% (chart below).11 Offices represent only 14% of total CRE assets in the U.S.12 If we think about this another way, the market capitalization of one company, Apple, is – at $2.6 trillion – larger than the entire capitalization of the U.S. office sector, at just over $2 trillion.13
The private office market represents a fraction of total capital wealth in the U.S.
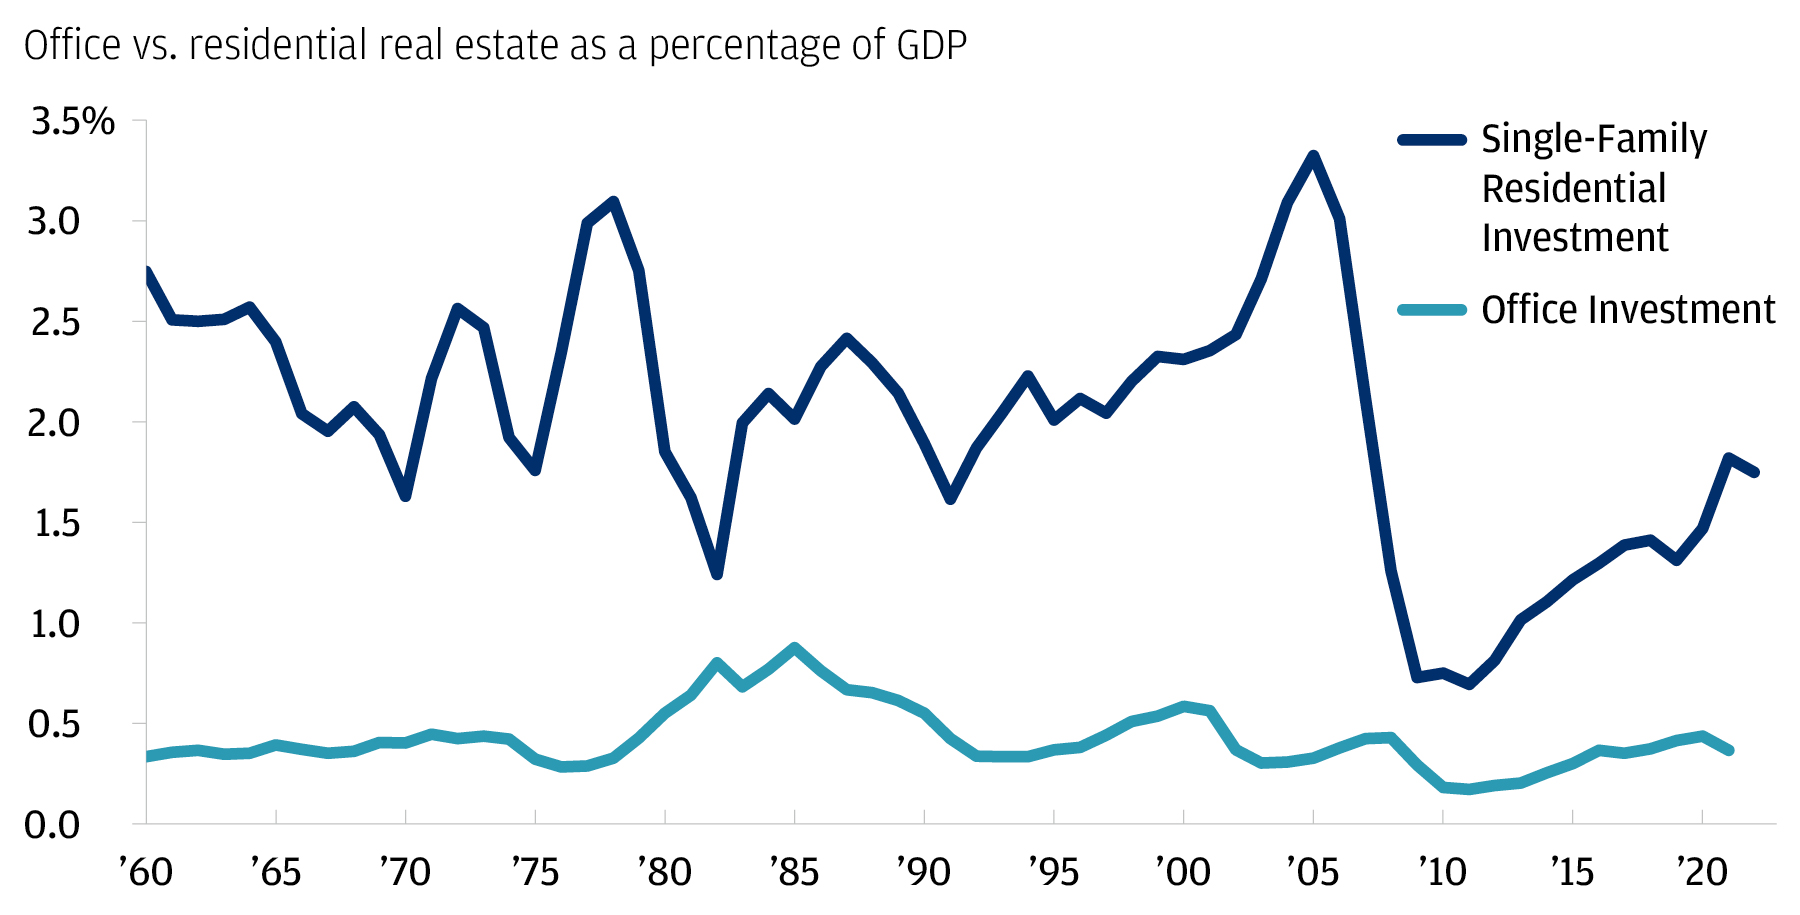
From a flow perspective, office construction represents an even lower share of overall U.S. GDP, at only 0.4% (chart below). Unlike single family residential investment, which soared to more than 3.3% of GDP in the mid-2000s before crashing and bottoming out post-GFC at around 0.7%, the office sector, in isolation, would likely not have anywhere near the same impact on the economy in the event that construction were to halt. It’s just not big enough.
Office construction remains a modest 0.4% of U.S. GDP
Furthermore, there are offsets to a weak office sector. In short, the weaker it is, the stronger residential and remote work related sectors will be, because the underlying source of the disruption to the office sector is technology, which is driving a shift in working patterns.14 Technological shocks usually aren’t recessionary or detrimental to aggregate demand, but they do create winners and losers.
In 2017, we made this same point with regard to the pervasive concerns at the time about brick and mortar retail assets: Throughout the 2010s, as overall GDP in the retail sector continued to rise, more of it went to e-commerce platforms while brick and mortar shrank. The upshot is that this shift represented a micro recession for brick and mortar retail, but not a macro recession for either the retail sector as a whole or the overall economy.
Small bank lending channel could potentially impact GDP
We feel confident that the office sector isn’t likely, in isolation, to be a significant source of GDP weakness. But broader and legitimate concerns about confidence in the banking system are relevant, especially questions about smaller banks and the credit they provide to the broader economy.
Inevitably, the latest spate of banking stress is a negative for economic growth because it will likely result in less bank lending. Quantifying that impact is no easy task, because the Fed will – in all likelihood – try to offset the impact of reduced lending via less restrictive monetary policy (larger, better capitalized banks may step in to fill the void as well).
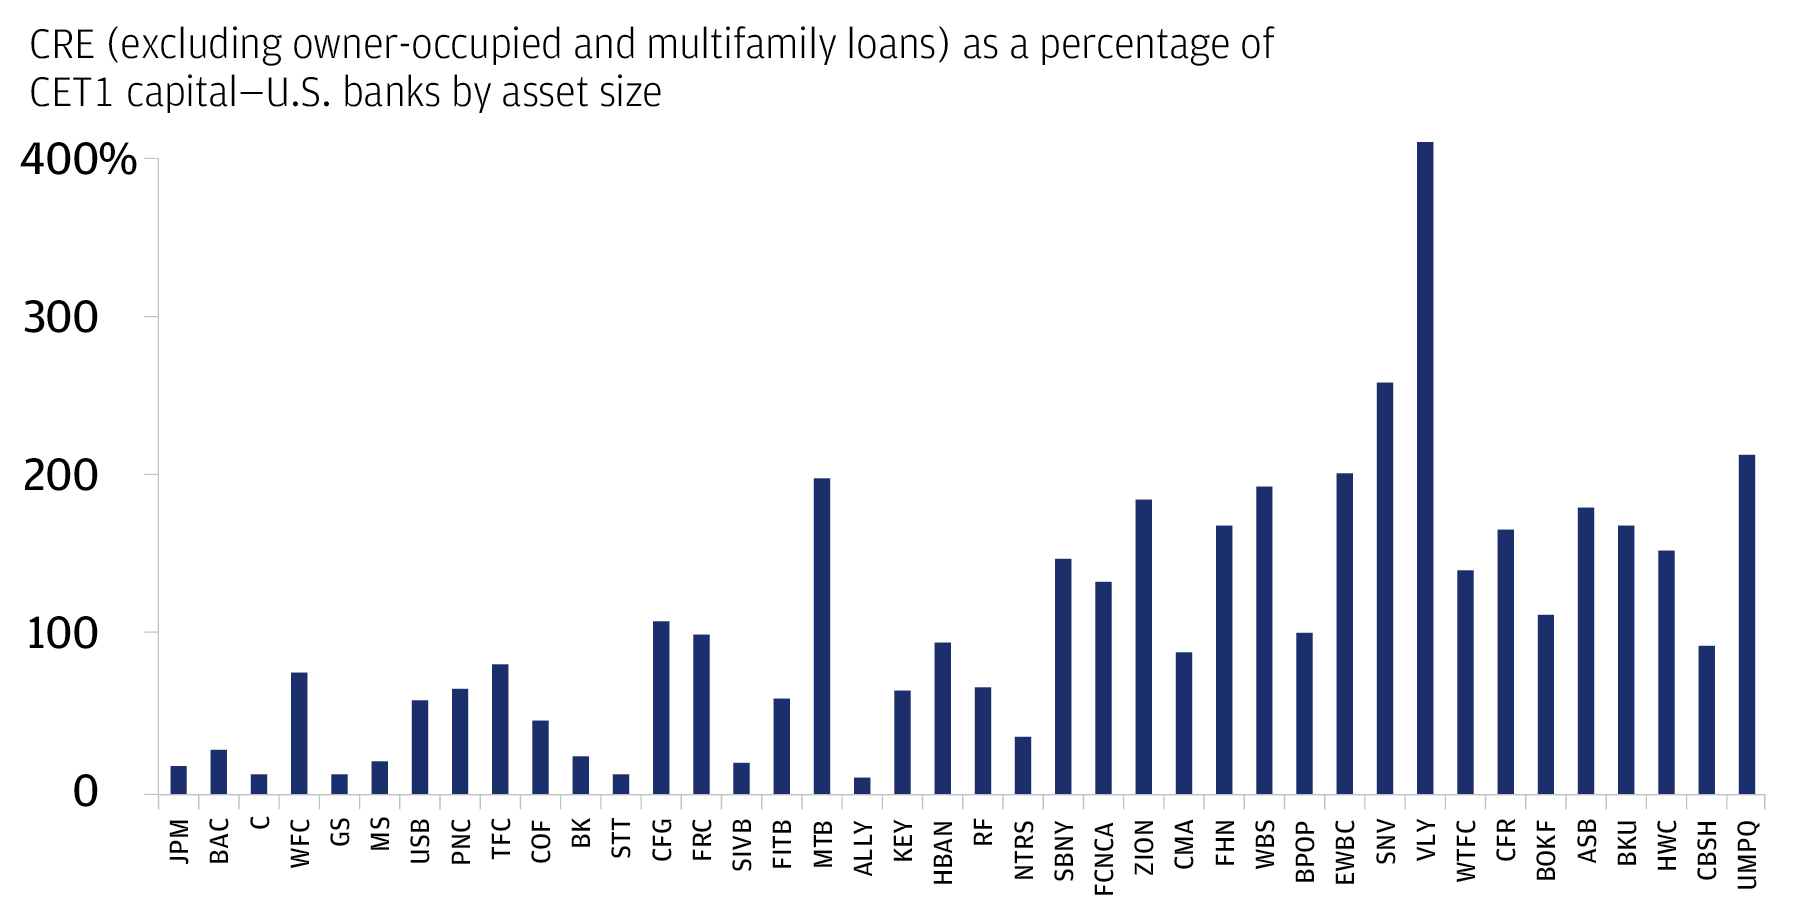
From an equities and credit perspective, we are cautious on the regional banking sector. As mentioned previously, these banks have approximately 4.4 times more exposure to CRE than large banks do. In the chart below, we show CRE exposure, excluding lower risk segments (owner-occupied properties, multifamily), as a proxy for higher risk categories (offices and vintage malls). We map each bank’s exposure as a percentage of its capital. While total exposure to the weakest CRE subsectors varies by bank, those with more than 100% of their capital in these buckets are more likely to be smaller regional entities.
Although visibility is limited, we see a wide range of CRE exposures across the banking industry
Market participants are trying to address a key concern: Will the potential stress in segments of the CRE market negatively impact earnings for regional banks – and create such significant drag for some that their capital could be impaired? Several factors will drive the outcome: the size of the banks’ exposure, the magnitude of their losses across vulnerable CRE sectors and the severity and speed of those losses.
Applying historical loss rates drawn from the GFC to office and retail holdings only, the impact in CRE would likely not rise to the level of a capital event for the banking industry. But we don’t yet know whether future losses will be confined to office and retail, or whether they will broaden. Our view is constructive: We see stronger fundamentals outside of office buildings and vintage malls, and we expect few losses beyond these two vulnerable CRE segments.
For a worst-case scenario, we need look no further than the Fed’s most recent industry-wide Dodd Frank Act stress test. In this exercise, the impact of a “severely adverse” market scenario would result in a 40% drop in aggregate CRE prices (i.e., a collapse in values that would not be confined to office properties and vintage malls). In this projection, the degree of capital erosion would be considerably more severe, with capital shortfalls likely becoming pervasive across the regional banking sector.
Clearly, this scenario is meant to represent an extremely bearish outcome for the U.S. economy – and does not represent our base case – but it does help answer the question “How bad could this possibly get?” Our base case assumes that aggregate CRE prices fall approximately 10%–15% in the current cycle (although for the office sector, we wouldn’t be surprised to see price declines of 30%–40% in the most stressed markets).
Investment implications
What does this mean for your portfolio? The trouble in the office sector – and its potential impact on bank lending and profitability – will contribute to an elevated probability of recession in the U.S. this year. In the portfolios we manage, we have been adding to assets that can help weather a downturn should one occur (e.g., core fixed income), while maintaining a balance across asset classes.
Within publicly traded real estate, the office sector has been one of the most popular shorts for the market since COVID-19 hit and prices already reflect material weakness. Some publicly traded REITs that focus on the industrial sector are also getting caught up in the turmoil, and we think they are approaching attractive entry points for investors who have less exposure to the space.
On the private side, the managers that we work with have limited exposure to U.S. office buildings, and opportunities may start to appear for specialists in distressed real estate in the coming quarters and years.
If you would like to discuss this topic in more detail or understand the potential opportunities for your portfolio, please reach out to your J.P. Morgan team.
Invest your way
Not working with us yet? Find a J.P. Morgan Advisor or explore ways to invest online.


Footnotes
-
1
J.P. Morgan North America Securitized Products Research. Data as of March 2023.
-
2
J.P. Morgan, Trepp. Data as of February 2023.
-
3
J.P. Morgan Research. Data as of January 2023.
-
4
Note: These expected liquidations/losses are for conduit CMBS exposures; Single Asset Single Borrower (SASB) exposures will likely experience lower distress given better credit quality.
-
5
J.P. Morgan North America Securitized Products Research, “CMBS Weekly: CMBS office loans—a lay of the land.” Data as of March 2023.
-
6
Barclays Credit Research, “Don’t Forget about the Malls.” Data as of March 2023.
-
7
J.P. Morgan, "Assets and Liabilities of Commercial Banks in the United States - H.8". Data as of March 2023.
-
8
CoStar, U.S. Census Bureau. Data as of March 2023.
-
9
University of Michigan. Data as of April 2023.
-
10
Jeffrey Langbaum, “Coastal, Sun Belt Rent Growth to Slow in 2023,” Bloomberg Finance L.P. Data as of March 2023.
-
11
World Bank, Bureau of Economic Analysis, Bloomberg Finance L.P., Haver Analytics. Data as of 2023.
-
12
CoStar. Data as of 2022.
-
13
Bloomberg Finance L.P. Data as of April 2023.
-
14
This technological shock (remote work) is also a source of the bifurcation in the office sector between newer builds and older vintages. Amid the war for labor talent, companies have tried to use newer office space in prime locations as a way to lure employees back into the office.